Reservations and items
In an ideal world, there would be no reservations: the library would hold sufficient numbers of copies of exactly what borrowers were looking for and no more.
Sadly we don’t live in an ideal world. Acquisition budgets are not limitless, and demand forecasting is not an exact science. One question that has come up on the the Talis Decisions forums recently is comparing reservation demand with stock, presumably on the assumption that works with far more reservations that copies on the shelves are candidates for a stock order.
There are a number of ways to tackle the creation of a report like this. Here is one:
Query
I specified two queries thus. As ever, you would should probably limit the total items query to items In Stock, and you can add other data if you wish…
…From the Reservations Universe
…From the Circulation Universe:
The Reports
To get a tabular report, you have four tasks
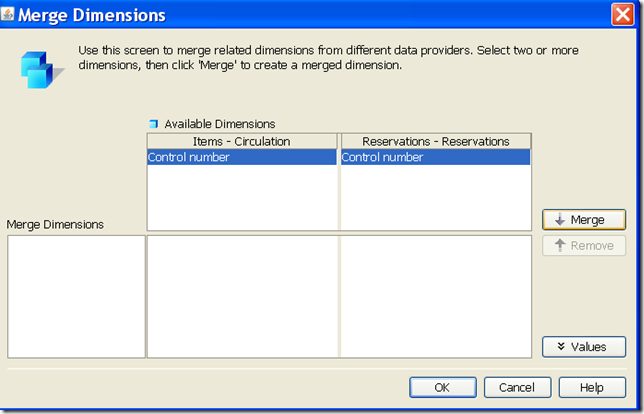
 Firstly, click the Merge Dimensions icon on the toolbar. This will pop up a dialogue which will allow you to merge, or synchronise, the two queries on Control number (if Talis Decisions has not already done so automatically):
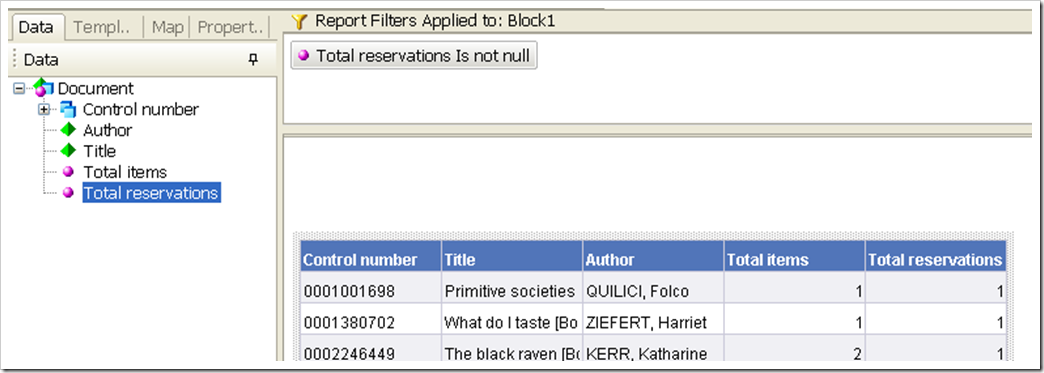
Secondly, drag Control Number, Author, Title and the two totals (items and reservations) into the report working area
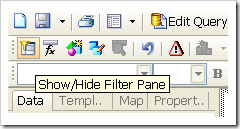 Thirdly, apply a report filter to remove rows where there are no reservations:
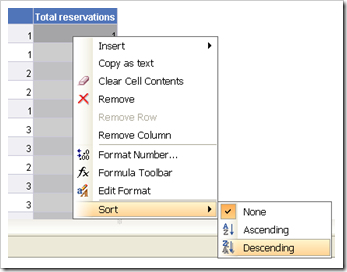
Finally, right click the Total Reservations column and sort it descending. This puts put the “most reserved” works at the top:
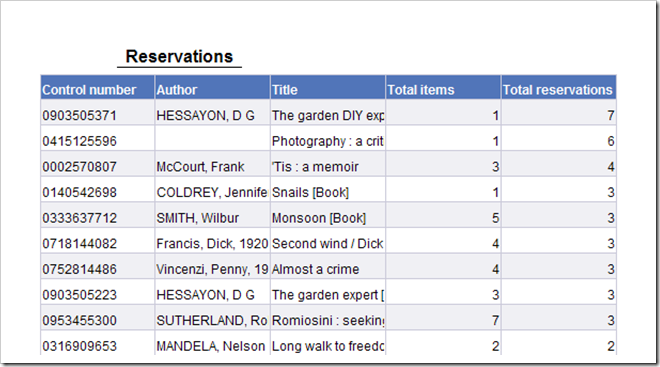
This results in a tabular report that looks like this :
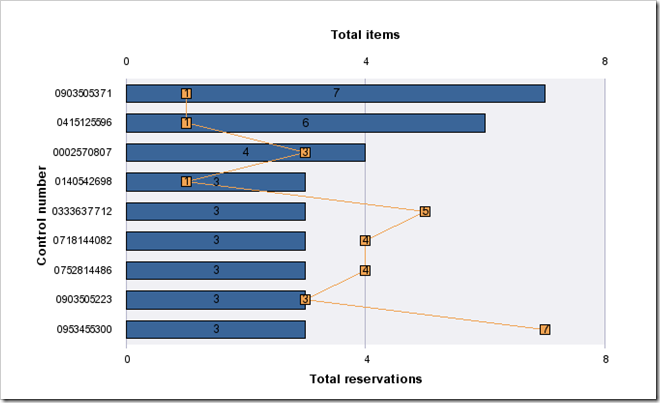
Finally. here is a chart created in the same Talis Decisions document from the same queries. It contains the same data as the table, albeit only the top few rows. It makes the point rather more dramatically
If you would like me to go into detail in a later post about how to create a chart like this, then please e-mail me or leave a comment. If you would like help writing this kind of report, have a word with your Account Manager.



March 22nd, 2010 at 11:24 am
I’d be very interested in being able to produce the chart. I had already created a query more or less exactly like the one you have (just added the month and date so that the report could be a bit more dynamic using the TDN article).