BusinessObjects (the company that builds the engine behind Talis Decisions) have recently come out with an extension to their product set which appears to offer a step change in the accessibility of management information for certain kinds of enquiry.
What it looks like
Suppose that you have had a complaint from a borrower that the stock at their nearest site all seems very old compared with the stock at the main library and you are trying to establish the facts.
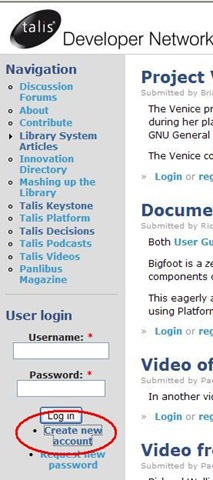
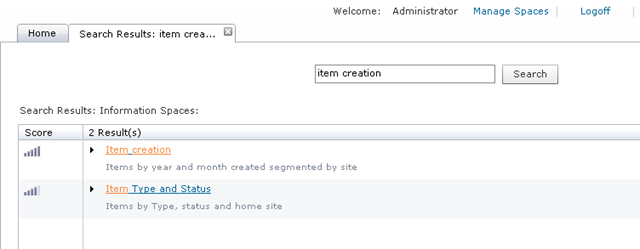
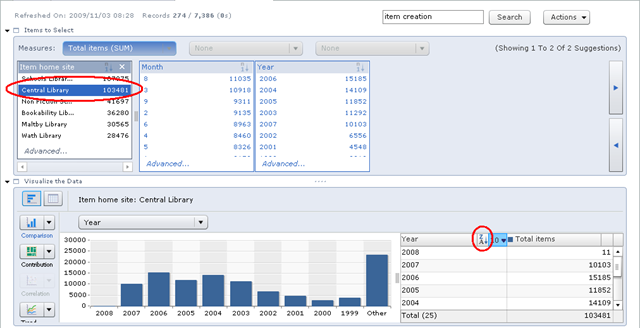
You are using the new tool populated with library data. When you first log on you are presented with a search screen not unlike Google or Prism 3. You type in item creation and hit Search:
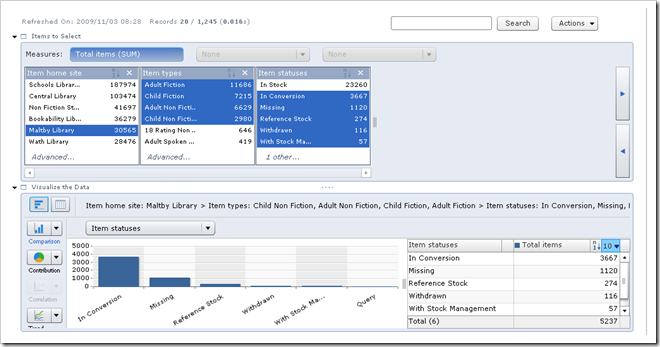
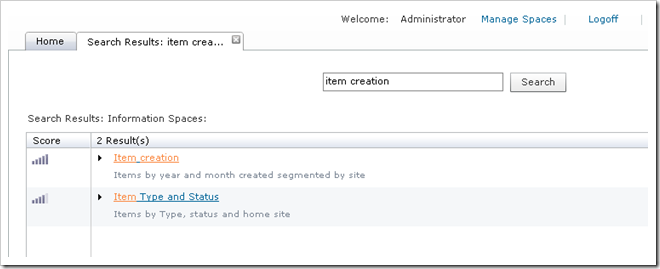 The software returns matching “Information Spaces” ranked by relevance. Note the ranking score on the left. You decide that the first one looks most promising so you click on it. This is what you see by default:
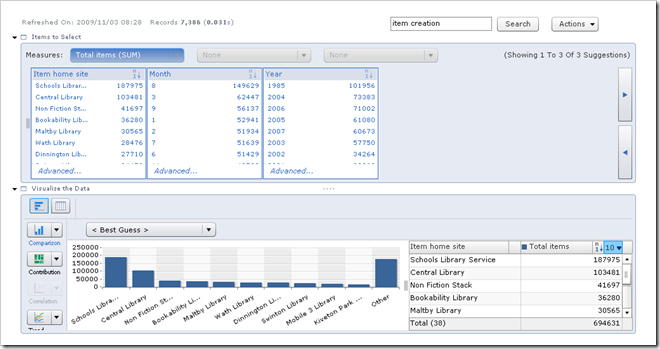
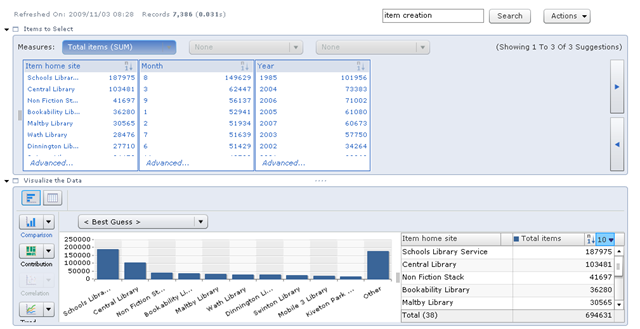
Forget the top panel for a moment; look at the bottom one. One click from a Google-style search and you are half way to your answer. By default it has given you the number of items at each branch – not exactly what you want, but getting there.
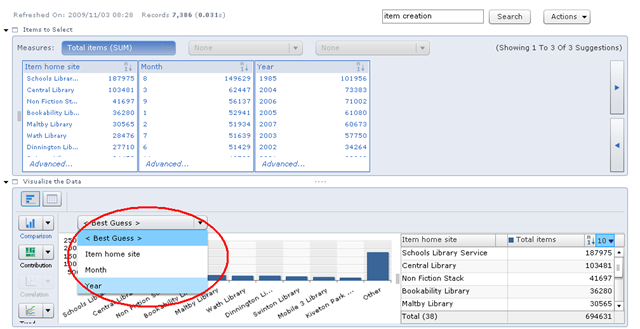
Note (and this is where the real power comes in), the graph at the bottom isn’t just a picture. It changes on the fly as you select different alternatives. The graph at the moment shows total items by home site. You want it by year (of creation), so you select that option in the drop-down:
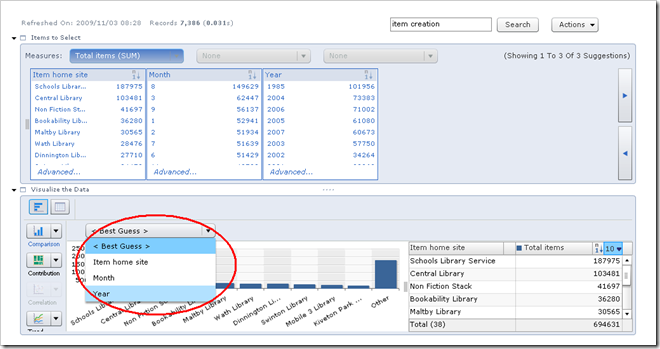
The graph refreshes with the new data in less time than it takes to read this sentence
Lets suppose that the two sites that we are comparing are the Central Library and Maltby Library (the sample data set in this example is from a public library but the same principle would apply in an academic library). You click on Central Library in the top part of the window and also select the sort order you want (decreasing year) in the summary table on the right:
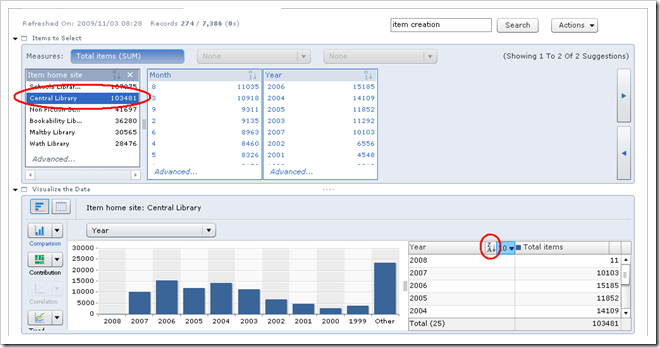
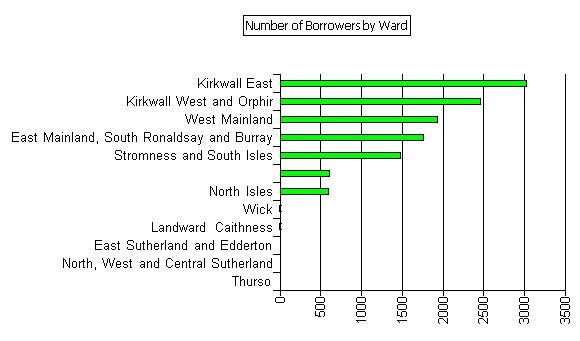
Change the chart type if you wish (e.g. to a pie chart), export it, and then click on Maltby Library, re-export and you have your evidence in a form that you can paste into a letter or post on a website.
Note what has happened here. In four or five steps you have got the information that you need. No one has had to write a query or understand the database. The formatting of the report has been largely automatic. Above all it has been immediate. There is no sitting around waiting for reports to refresh.
What might it be good for?
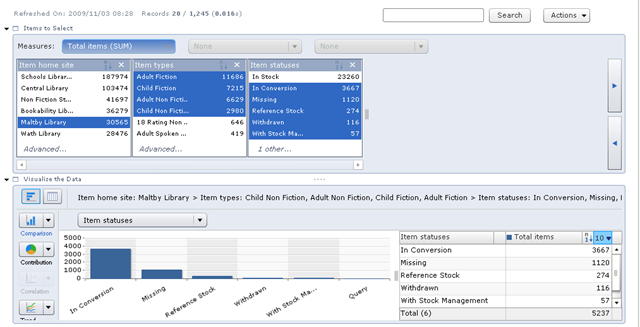
Experience would be the final arbiter, but it looks like this tool is ideal at digging down into data, Here is an example showing the numbers of adult and child fiction items at Maltby library in any state other than In Stock (look at the selections at the top):
It seems probable that this would be very useful in three kinds of situation:
- There is some unexpected or anomalous figures in routine reporting and you are trying to establish why.
- You are doing some what-if planning, perhaps (for example) around site closures, opening hours or supplier performance.
- There has been a Freedom of Information (FOI) request for something not reported routinely (e.g. number of cancelled ILLs at someone’s local site).
What it probably isn’t good for
The tool is clearly oriented for ad hoc, interactive use. There are several things that would probably still be better done in Desktop Intelligence or Web Intelligence. In particular it is probably not ideal for:
- Long lists used for operational tasks (e.g. items that haven’t been issued for a while and are therefore candidates for withdrawal)
- Routine reports that are scheduled to run at particular times and/or are distributed automatically to a number of recipients.
Under the bonnet
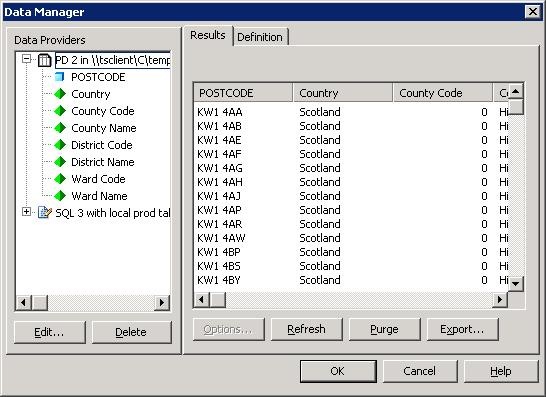
The technology is an example of in memory analytics. “Information Spaces” based on new or existing Universes are created as part of the tool set-up and refresh automatically. This creates an index file. When the end-user clicks on an information space, the index file is loaded into memory and can thereafter be used interactively. The same principle is used in tools like Qlikview
What do you think?
On the face of it, it might be possible to integrate this into Talis Decisions. We would have lots to do (for example to check that it wouldn’t overstretch the hardware that most users have), and we are right at the start of the process. It would however be very interesting to know whether you would judge something like this to be potentially useful.
Please can you let us know (by adding a comment) whether in your opinion, this kind of capability might be:
- Extremely useful
- Fairly useful
- Possibly useful
- Not something you would use much
- A fun toy but hard to justify
- Irrelevant
- {Anything else that you would like to say}
This is just a rough initial straw poll. We shan’t hold anyone to their opinion(!)

Recent Comments