Decisions Blog

Archive for July, 2009

Google Analytics in Talis Decisions

Back in March I touched on Google Analytics. For those who haven’t come across it, the principle is simple. A small module can be embedded in any web page which sends data about use of the page to Google Analytics. An appropriately authorised user can then log in and view aggregated statistics in a browser.GA1

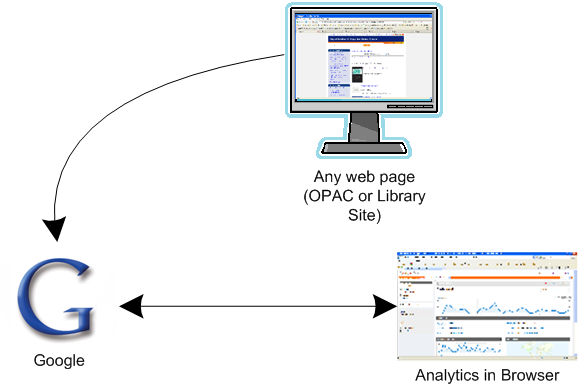
This is an example of Google Analytics report output in a browser:

GA2

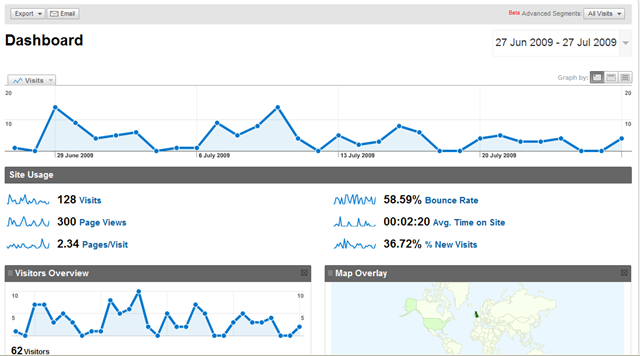
The principle is the same as a simple “hit counter”, but Google Analytics offers much more detail. Indeed, one of the difficulties that some folk have with it is seeing the wood for the trees. Just because Google Analytics allows me to track Browser Screen Colour, City of origin and Connection speed, it doesn’t mean that (depending upon my role) I need to pay attention to them all. If total visits or new visits are the only important metric for the job in hand, then the rest is (for me at the moment)  just noise. As ever, the key is to think about what you are trying to do before deciding what information you need to do it.

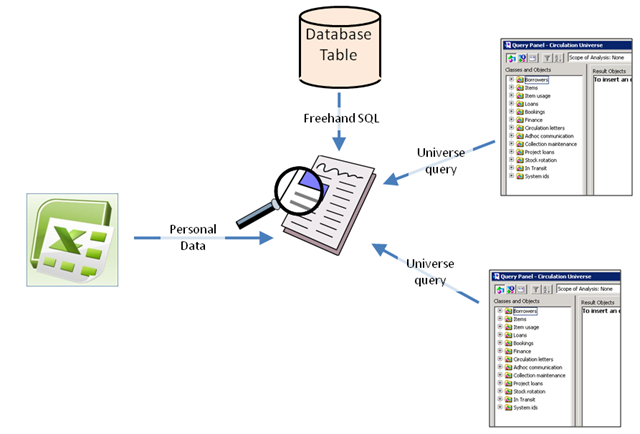
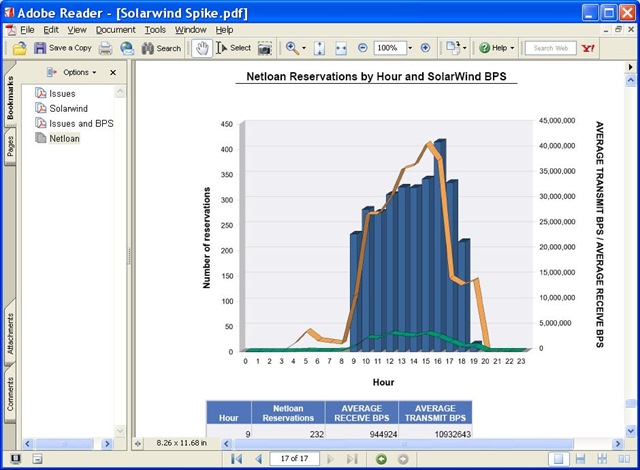
The other consideration is that these data are unrelated to anything else. You may want to see Google Analytics data combined with other data from your library. It is possible to extract the data out of Google Analytics without using the browser interface. Here is a sample report in Talis Decisions combining number of Prism 3 visits from Google Analytics (yellow bars), Netloan data (red line) and Loan/Issue data (green line) showing the average throughout the day by hour on the same chart:

GA3

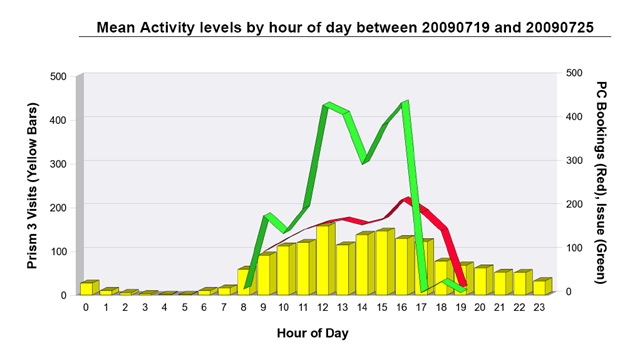
This report was created using the same approach as that described in an earlier blog. The Netloan and Universe data are from conventional Universe queries. The Google Analytics data was downloaded straight into Microsoft Excel (I used an open source programme: Excellent Analytics, although I have not used it enough be in a position to recommend it specifically).

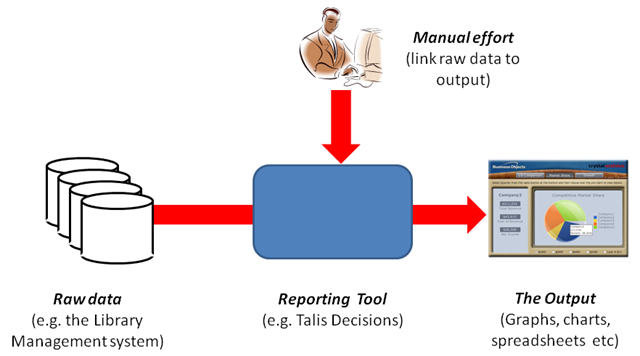
This approach could be replicated today by anyone with both Talis Decisions and Google Analytics, although updating any reports would involve significant ongoing manual intervention. We could probably simplify access to Google Analytics data from within Talis Decisions if there was sufficient demand for it. Please do e-mail us, speak to your account manager and/or leave a comment if you are interested in pursuing this.

Combining data from multiple Sources

Last week I posted a few examples of reports that combined data from the Netloan and standard universes. Someone has since asked me to talk a bit more about combining data from multiple sources.

In principle, any Management Information or  Business Intelligence tool works like this:

Generic BI

It is possible to use any of the following to do this:

  1. Self service tools like Talis Decisions
  2. Fixed reports built internally using a toolset like Qlikview, Dynistics or LogiXML
  3. Fixed reports built by a third party like SmartSM
  4. Data warehouses built on powerful (and expensive) enterprise software from companies like Oracle.
  5. Web based service like Pivotlink

In principle all these approaches use this same basic pattern. Most store copies of the data in some form

Manual EffortRegardless of the approach, the devil is in the detail. If your data source is at all complex, it takes significant skilled manual effort to link the raw data to the output regardless of approach. Don’t let a tool vendor tell you otherwise.

Either a third party does this work, in which case the user is stuck with little flexibility, or he/she has quite a lot of work to do before seeing useful output.

Talis Decisions tackles this in two steps in an attempt to get the best of both worlds: (relative) simplicity and far greater flexibility than is possible with pre-built reports

  1. Talis supplies a number of pre-built “Universes” to simplify the process of extracting the data
  2. The user (or a technical intermediary) builds the required reports using the Universes rather than going back to the raw data

Sometimes however, a user may want to produce a report which contains data from different Universes, or even combine data from a Universe with (for example) data from a spreadsheet on the user’s PC. This was the approach used in the Netloan examples.

A blog isn’t the place to go into a lot of technical detail, but the fundamental approach is to define multiple queries and merge  the results of all the queries in Talis Decisions. There is an article on this on the Talis Developer Network (TDN).

Web intelligence allows multiple Universe queries. Desktop Intelligence also allows the use of local files (“Personal Data”) and “Freehand SQL” (there is a TDN article on Freehand SQL too) which allows you to query the database directly if you wish. Putting it all together, you can create a report combining data from a range of sources:Multiple Queries

The first two Netloan examples just combined two Universes, the third one two Universes and spreadsheet.data..

Netloan Universe

You may have seen the announcement a couple of weeks back about the new Talis Decisions universe and associated files to allow access to data originating in Lorensberg’s Netloan installations.

Here are some illustrations of the kind of reports that can be produced by combining data from the Netloan and Circulation universes (click the pictures to enlarge);

PC Booking Example 1

This example plots issues in each hour through the day (represented by the height of the blue bars) alongside the number of PC bookings, also broken down by hour of day (Orange line). Such a report might for example be used as an input to staff planning. The drop-down menu at the top left is a drill filter on the site (at present it is showing all sites, but in principle the figures could be filtered for an individual site).

PC Booking Example 2

The second example counts the number of unique visitors against the purpose of their visit (item issue or PC booking). In this particular example there was no overlap between the people who came in to borrow something and the group who came in to use the PCs, but the report would be quite capable of showing a third type of visit (“Both”) which would make a third pie segment. This report is more complex to produce (it uses variables for Visit Type and Unique Visitors) but does not require any other special treatment.

You can also combine Netloan Universe data with spreadsheets or other data sources. Recently, a customer kindly sent me some statistics from their Network Management software. Here is an example (exported as a PDF) which combines these two sources of data (PC bookings and network statistics) in the same Talis Decisions report:PC Booking Example 3The report shows the number of PC booking reservations in each hour of the day (blue bars), the “Transmit” Network traffic (orange line) and the “Receive” Network traffic. This could be useful if you were trying to isolate a problem: in this example there is clearly a big peak in bookings around 4:00 p.m, with an associated peak in network traffic, but another unexplained peak around 7:00 p.m.

Please do let us know what you think of the usefulness of this new Universe: e mail us or just add a comment by clicking on the bubble in the top right of this post.