Decisions Blog

Archive for the 'Uncategorized' Category

Reservations and items

In an ideal world, there would be no reservations: the library would hold sufficient numbers of copies of exactly what borrowers were looking for and no more.

Sadly we don’t live in an ideal world. Acquisition budgets are not limitless, and demand forecasting is not an exact science. One question that has come up on the the Talis Decisions forums recently is comparing reservation demand with stock, presumably on the assumption that works with far more reservations that copies on the shelves are candidates for a stock order.

There are a number of ways to tackle the creation of a report like this. Here is one:

Query

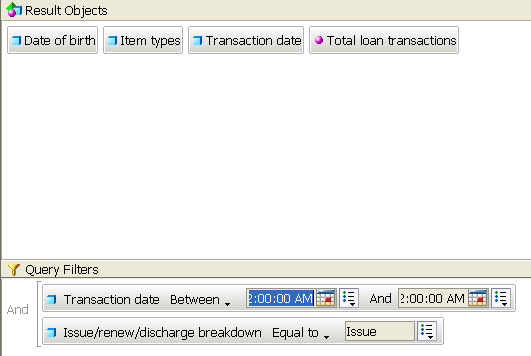
I specified two queries thus. As ever, you would should probably limit the total items query to items In Stock, and you can add other data if you wish…

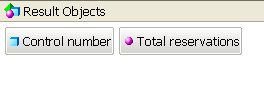
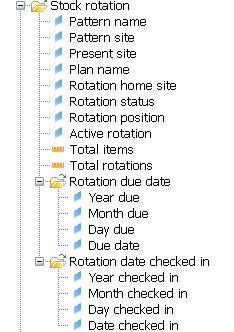
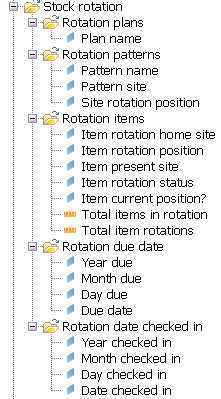
…From the Reservations Universe

SP32-20100318-154757 

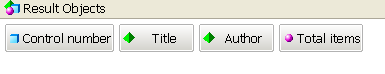
…From the Circulation Universe:

SP32-20100318-154815 .

The Reports

To get a  tabular report, you have four tasks

SP32-20100322-100446
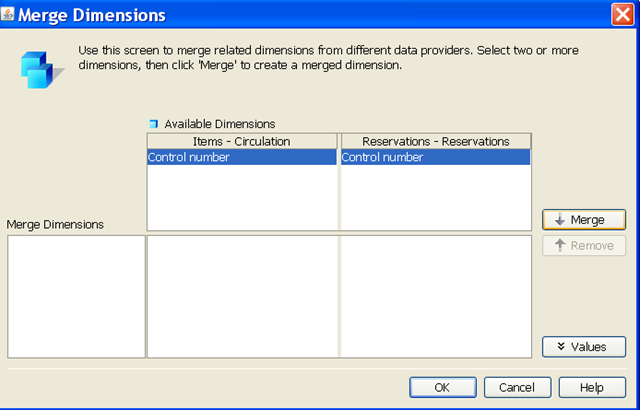
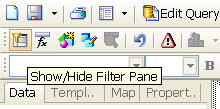
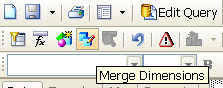
Firstly, click the Merge Dimensions icon on the toolbar. This will pop up a dialogue which will allow you to merge, or synchronise, the two queries on Control number (if Talis Decisions has not already done so automatically):


SP32-20100322-095410

Secondly, drag Control Number, Author, Title and the two totals (items and reservations) into the report working area

SP32-20100322-100906
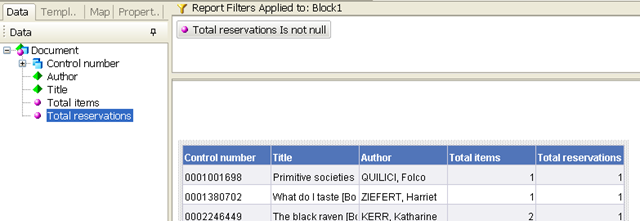
Thirdly, apply a report filter to remove rows where there are no reservations:


SP32-20100322-095711

SP32-20100322-100215


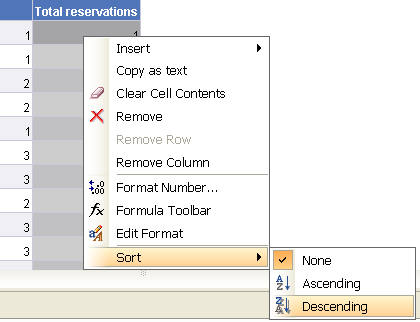
Finally, right click the Total Reservations column and sort it descending. This puts put the “most reserved” works at the top:


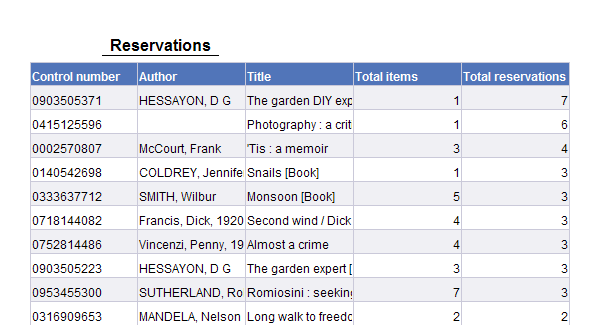
This results in a tabular report that looks like this :

SP32-20100322-092650

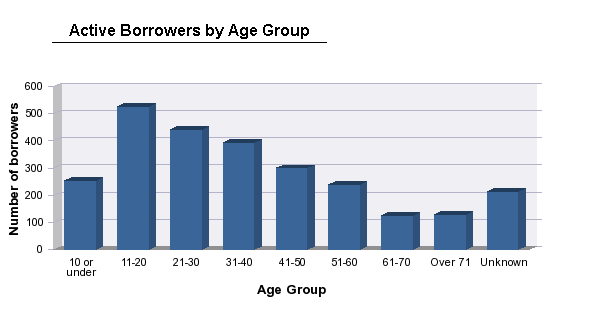
Finally. here is a chart created in the same Talis Decisions document from the same queries. It contains the same data as the table, albeit only the top few rows. It makes the point rather more dramatically

SP32-20100322-092736

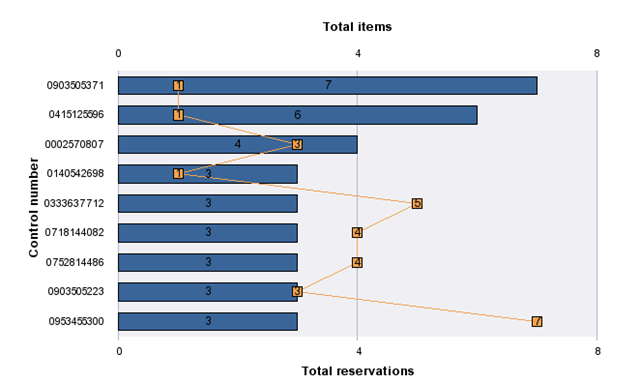
If you would like me to go into detail in a later post about how to create a chart like this, then please e-mail me or leave a comment. If you would like help writing this kind of report, have a word with your Account Manager.

Key Performance Indicators (KPIs) – Take 3

For my last post on KPIs (for the time being anyway), I thought I would provide links to other guidance on the topic. There have been many papers on library performance management with many being published in the early to mid 1990s. See for example this bibliography from Canada. Here are a few more recent offerings:

Measuring Quality; Performance Measurement in Libraries 2nd revised edition

This handbook was first published in 1996 for academic libraries only. The 2007 edition has been extended to cover both public and academic libraries. Copies are available for sale from the IFLA. A table of contents is available here.

ISO 11620 – Information and documentation — Library performance indicators

This was first published in 1998. A revised (2008) edition is available from the International Standards organisation (ISO). From the Abstract:

ISO 11620:2008 specifies the requirements of a performance indicator for libraries and establishes a set of performance indicators to be used by libraries of all types. It also provides guidance on how to implement performance indicators in libraries where such performance indicators are not already in use.

Working towards Outcomes Assessment in UK Academic Libraries

(Journal of Librarianship and Information Science.2003; 35: 93-104 )

This article attempts to suggest ways to evaluate the performance of an academic library based on research outcomes. It is available here.

If you know of, or use, other recent guidance in this area, please do leave a comment

Age restricted DVDs

Public libraries self-issuing DVDs or academic libraries self-issuing material available to (say) postgraduates and staff only share a problem with on-line retailers: how do you establish the right of the individual to check the item out?

Although in theory, libraries are in a stronger position than on-line retailers because they have registration data about their borrowers, in practice this area is potentially affected by a number of issues ranging from data accuracy and completeness to the functionality of the physical terminals.

Regardless of operational practice, one need which may arise is the reporting of exceptions: that is to understand how big the problem is. This scenario assumes that borrower date of birth data are accurate and that there is an item type of “Adult DVD”. This will illustrate the principle, although the detail will vary from library to library.

The basic query returns the date of birth, the loan date, the item type and the loan count. The query is filtered on loan date (not least to cut down the refresh time) and also limits the results just to issues:

SP32-20100222-134823

Once the query has run and has populated a default report, you can then create a variable that returns the age of the borrower at the point that the item was loaned. This is done using the MonthsBetween() function, dividing the result by 12 and using the Floor() function to round down to the nearest year. The whole variable definition looks like this:

SP32-20100222-134032

There are many ways that the data could be displayed. Here is one example – a chart that displays the number of loans of an adult DVD by age of borrower at the time of the loan for borrowers between 7 and 17:

SP32-20100222-141405

In theory, Talis Decisions could use external data to look up the British Board of Film Censors (BBFC) details of a DVD, but in practice this is likely to be confounded by lack of consistent identifiers for DVDs, multiple editions of the same DVD and other data issues.

Does anyone have any experience or any views on this look-up approach? If so, please do post a comment

Key Performance Indicators (KPIs) – Take 2

I’ve mentioned KPIs in a number of previous posts, and promised to do so again. Some libraries not only use them but publish them: here for example is a publically-accessible report on performance against KPIs at Monash University in the USA.

It is important to remember that there are two parts to a KPI:

  • What you are going to measure (e.g. “percentage of items returned from loan re-shelved within 24 hours Monday to Friday”).
  • A target value or measure (maximum or minimum value (e.g. 90%).

The first (what you are going to measure) tends to have a longer lifespan  than the actual target number which can change – typically from year to year. An annual operating budget is a good example of a KPI: “what” is the same from year to year i.e. “how much money you are going to spend”. The actual budget value changes from year to year (unfortunately, often downwards!)

KPI’s are useful only as marketing collateral unless they can lead to action: action to improve a KPI that is falling short of target. Use of KPIs then becomes a five step process:

  1. Decide what you are going to measure (e.g. “percentage of items returned from loan re-shelved within 24 hours Monday to Friday”).
  2. Agree a target value (e.g. 90%)
  3. Collect actual real world performance data
  4. Compare target and actual
  5. Decide what action to take if they are not in line (e.g. reassign staff, buy an RFID sorter etc etc.)

KPI1

Do you use KPIs in your library? If so please do add some examples via the comments option. If not have you tried them but not been able to make them work for you? And what has been the sticking point – deciding what, agreeing values or following through to action?

Age Bands and Class mark Ranges

It is sometimes very useful to be able to group items, loans or borrowers by some characteristic, where the groups are not held explicitly, but are based on something else that is known. For example:

  • Borrower Age Band (e.g. “under 10”, “11 – 15” etc)
  • Class mark Range (e.g. “000 – 100”, “101 – 200” etc)
  • Issue Transaction time periods (e.g. “morning”, “lunchtime”, “afternoon”, “early evening”…)

Here is a typical report produced by Talis Decisions:

Loans by Age Band

Note that the Age Band data are not held in Talis Alto. They are calculated by Talis Decisions using a variable based on the borrower age like this:

=If ([Age] > 1000; "Unknown";
If ([Age] < 11; "10 or under";
If ([Age] < 21; "11-20";
If ([Age] < 31; "21-30";
If ([Age] < 41; "31-40";
If ([Age] < 51; "41-50";
If ([Age] < 61; "51-60";
If ([Age] < 71; "61-70";
"Over 71"))))))))

This  example is described in more detail in the document Using the Talis Decisions Universes – Some Examples available from the Documentation area of the website. There is another example in the Community section of the Talis Decisions website from Aberdeenshire of a similar approach being used to segment stock by Dewey classifications.

As ever, if you like the look of this kind of report but are unsure of how best to tackle it at a technical level, we can always write one to your specification. Please contact your Account Manager to organise a quote.

And if you are already doing this kind of thing and feel that your experience might benefit others, please do let us have a description or examples which could go on the Community page of the website.

Technorati Tags: ,

Talis Decisions Universes V5

The Talis Decisions Universes V5 are available from the download area of the Talis Decisions site. These are primarily intended to complement the Alto 5 release. They do also include a number of improvements. These are detailed in the Release notice, but one significant improvement is in the area of rotations. Compare the Stock Rotation class in Universes up to version 4.3 with the Stock Rotation class in Version 5:

Version 4.3

Version 5

SP32-20100201-103444 SP32-20100201-103056

These changes should make it easier to write reports which show what items are in which patterns and where they are.

Note also that these Universes are available for Talis Decisions powered by BusinessObjects XI R2 and for Talis Decisions powered by BusinessObjects XI R3.1. They are not available for earlier versions.

As ever, please do let us know how you get on with these new Universes: and if you need assistance (e.g.. in writing a suite of rotation reports), or to arrange an upgrade from 5i so that you can use these new Universes,  please speak to your account manager.

Augmenting Talis Decisions

Talis Decisions is a powerful and flexible reporting tool, but there are some things that can be done more easily in other ways. These include reports that also perform an update.

Examples include

  • reports of items that have not been loaned for a while that also set the status to withdrawn (see a recent post on stock management). We were asked to do this recently by a public library customer, and wrote a specific Perl script to the customer’s specification do both the reporting and the Alto update.
  • Another example (for the same customer) was a script which didn’t merely report on popular items, but also updated the item type on Alto in accordance with the library’s preferences
  • Another customer wanted to check stock using data from an RFID wand to report missing items and to set the status on Alto accordingly; again we wrote a bespoke script to implement the behaviour that they wanted.

Perl ReportingIf you are interested in this type of combined reporting and update, please contact your Account Manager

Technorati Tags: ,,,

Using Talis Decisions to help manage stock

Managing stock is really about ensuring that the right items are available in the right quantities in the right places at the right times within the constraints of acquisition and operational budgets.

Traditionally this was done by the application of instinct and experience. As much of Western industry and commerce has discovered over the last 40 years, instinct and experience can be a poor substitute for decisions made on the basis of hard numbers. There is therefore increasing pressure in many areas to justify decisions on the basis of good data – whether in evidence-based medicine or the selection of baseball players in the USA.

In University libraries, one of the many benefits of Talis Aspire is that it can provide evidence for the library that feeds into the acquisitions process. In the public library sector, at least one Talis partner: (Bridgeall with their SmartSM product) specialises in stock management.

It is also possible however to use Talis Decisions to manage stock. We have produced a free paper which illustrates with example workflows and reports how Talis Decisions can be used to manage stock in Public Libraries:

SP32-20100118-100232 SP32-20100118-100632 SP32-20100118-100833

For your copy, contact your account manager, or email sales@talis.com.

Variables in Talis Decisions

Variables in Talis Decisions are well worth understanding, because they help greatly in producing polished reports. Variables are created by combining or manipulating “real” data brought back by a Universe query. Once created, variables can be used in charts and tables just like any other piece of data. Here are just three examples from many where variables can be useful:

  • Deriving a postcode district from a full postcode
  • Producing statistical output not available from the Universes such as mean, median, mode, standard deviations, variance etc
  • Adding a fixed prefix to barcodes for loading to an RFID hand-held device

SP32-20100111-122553

There are two new videos on the Video tab of the Talis Decisions site introducing the concept of Variables in Talis Decisions. [All the videos on this part of the Talis Decisions site are free to view. They are mostly about authoring reports in Web Intelligence and are in bite-sized chunks about 5 minutes long.]

If you create reports in Talis Decisions, all these videos are well worth a look if: and if you are becoming more sophisticated in your use of Talis Decisions but haven’t ventured into the use of variables, then the new variable videos will be particularly useful. As ever, any comments on the new videos will be gratefully received…..

SCONUL Statistical Return 2008-09

The deadline for the 2008/2009 SCONUL return is Friday 8th January 2010 (this Friday as I write). Much of the data needed for the returns are not known to the Library Management System. For example Section 1 has questions about floor space, Sections 3 and 5 cover staff and 8 covers library income.

There are questions that Talis Decisions can help with however – particularly Stock in Section 2, Loans, Borrowers and ILLs in section 4, and some of the data in Section 7: precisely which questions Talis Decisions can help with will depend on the data held.

There is a document on the Talis Developer Network which introduces a number of example reports which can also be downloaded from the TDN.

SP32-20100105-142230

These example reports are written using Desktop Intelligence and should be regarded as exactly that – examples – and not simply downloaded and run without any understanding of how they work, or of the assumptions made in their design.

Note also that the Statistical return itself is subject to change, so the cross-references to the actual question numbers in the return may be not be wholly up to date: this is again congruent with the intention to provide an exemplar rather than an out-of-the-box solution (which could never be wholly satisfactory, given the differences in data and working practices between libraries).

If you have experience using these exemplars (for good or ill) please do add a comment to the blog: we’d love to understand more about how we can best support the production of SCONUL and CIPFA returns