Decisions Blog

Archive for the 'Uncategorized' Category

The Last Mile

For those who do not know them, the Gartner Group are a highly-respected commercial Information Technology (IT) research organisation. They even have their own channel on Youtube.

Earlier this year they published a report “Overcoming the Gap Between Business Intelligence and Decision Support”. This concluded rather alarmingly:

“Although the promise of better decision making is a top driver of business intelligence
(BI) and performance management investment, information generated by BI systems
and other decision inputs are rarely linked to business decisions and outcomes.”

Other commentators (here and here) have  echoed or re-interpreted these ideas. Stripped to their essentials, the suggestion is that we are quite good at repeatable processes to collect data and produce reports on performance, but much less good at applying the intelligence gleaned from those reports in a repeatable way. The analogy (which is not used in the Gartner paper itself) is of the last mile from a telephone exchange to an individual house or business which is often a bottleneck in telecommunications.

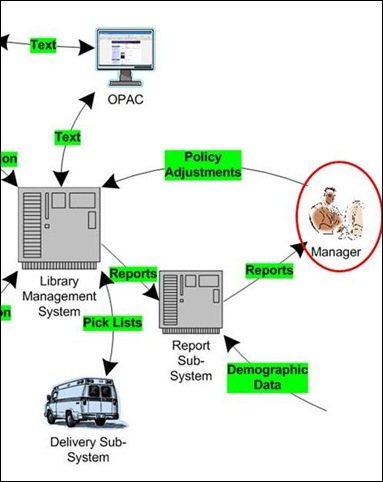
MI example 2


Gartner suggest some possible technological aids for helping out here, but the report once again emphasises the need to understand what a report is to be used for, and how it is going to be used: (in other words the workflow which it will fit into) before going to the trouble and expense of producing the report.

This is an area that Talis can help with too in the form of process consultancy. As ever, have a word with your Account Manager if you would like to find out more.

Marketing the Library through Facebook?

There have been a number of articles and papers recently about using social networking sites such as Facebook for marketing the library.

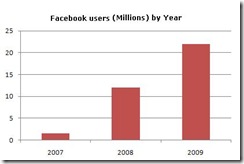
Facebook Users There are some extremely powerful considering this: most students will have an account on Facebook, Bebo or one of the other networking sites (probably Facebook). According to data from comscore, Facebook had around 1.6 Million UK users in Jan 2007, 12 Million in Feb 2008 and 22 Million in Feb 2009. Between June 2008 and June 2009 the number of UK Facebook users in the UK in the 15 – 24 year old age group increased by over 50%.

Of course it might be a bubble, a trend that will go up like a rocket and down like the stick.

But it might not. There are already a number of papers around suggesting that such sites might be useful for marketing purposes by libraries. Examples include a paper written by David Xia and published in Library Management (Volume: 30 Issue: 6/7), and an earlier case study published by LASSIE: “Libraries and Social Software in Education”.

Marketing (like any activity) is expensive. An early decision, for any library that choose to go down this route, will be to decide how to monitor the effectiveness of any expenditure in this area, bearing in mind that positive returns may require investment in time and and the accumulation of experience.

Power versus ease of use

In the last 20 years I have looked at dozens (maybe hundreds) of different bits of software designed to support the production of Management Information. The interesting thing is that they all demonstrate well. The formula is invariably a simple database with fairly small amounts of data, a little dragging, dropping and clicking and – hey presto! – a report produced by the salesperson in moments.

The real world is more challenging than that. Underlying data structures can be complex and even messy. Years ago I was doing some work for a large retail bank. Their core banking system had a view of a customer who could have a number of accounts. Their Credit Card system on the other hand had no concept of a Customer. It was based on card numbers – the “customer” was just a name associated with a card. The management wanted a holistic view of their customers. The customers wanted all their dealings with the bank on one sheet of paper. The bank spent millions on a specialised Management Information system and even then only partially solved the problem.

Depending upon working practices, the data available may be incomplete or inaccurate. Hospital Patient Administration Systems (PAS) may contain accurate administrative data (who was admitted when for example) but the diagnosis and treatment data on them are in general woefully and notoriously inaccurate. This is a result of the way that the data are recorded. In one case that I came across a “URTI” (Upper Respiratory Tract Infection) had been coded as a “URT” (Urinary Tract) infection.

Given these messy features of the real world, Management Information System software has to make a tradeoffs. Is it going to be like a…

  • Magnifying Glass …magnifying glass – easy for anyone to pick up and use, but restricted in the kinds of problems it can handle, or like a…


  • Microscope …specialised microscope – hugely powerful, but expensive to buy and needing constant input from highly trained operators


There isn’t always an easy answer. Software powerful enough to answer all the questions that need answering may not be cheap to buy or easy to use. Software that can be used by anyone may not be up to tackling the hard questions.

Please let us know how well you think we are doing with this balance in Talis Decisions. Do comment on this blog or e-mail me at jlgh@talis.com.

Talis Decisions courses

There are a couple of Talis Decisions courses coming up in the Autumn which may be of interest.

Exploring the Talis Decisions Universes is a webinar intended for folk who create or modify reports in Talis Decisions. It goes beyond the basic course to explore the details of the Talis Decisions Universes, exploring issues such as “why are there several ways to get a postcode? What is the difference? or “why do I sometimes get fewer results than I expect?” Being a webinar there are no travel costs involved (all you need is an Internet-connected PC and a phone).

Making the most of Talis Decisions is a face-to-face event being run at several alternate locations. This is intended for practitioners (those who are concerned primarily with the management of libraries rather than the mechanics of report production). It is intended to augment understanding what Management Information is potentially available through Talis Decisions.

I’ll be at both. Looking forward to talking to lots of folk in that context.

Talis Bridge Management Information

I’ve talked quite a bit recently about retrieving useful management information from sources other than Talis Alto. I’d like to add one more to this list: Talis Bridge.

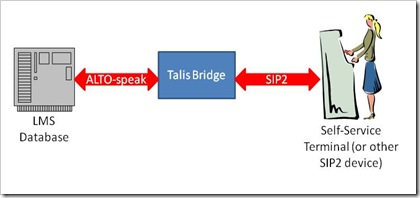
Bridge 1 Talis Bridge (for those not familiar with it) is in essence an adapter or go-between: it enables devices (such as self-service terminals) that understand the SIP2 protocol to talk to the LMS database directly.

Most of the key data from Self Service transactions can be reported using Talis Decisions: for example the loan transactions done at a self-service machine can be reported just like a manual loan – indeed, to the database the structure of such loans is just like that of any other loan, The usage of particular machines can be monitored by configuring the self service machines with unique operator IDs, and then filtering a loan transaction report by operator.

Bridge 2

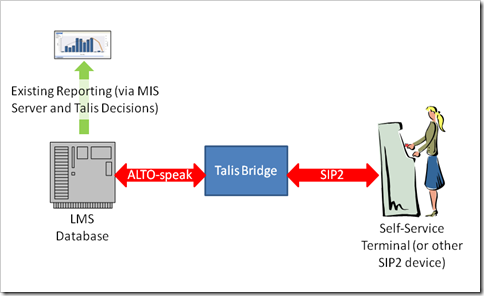
This works well for many purposes but it is not possible to monitor failures this way: i.e. situations where a user went to check an item in or out, but was unable to do so for some reason. Many SIP2 devices have their own reporting, but clearly it is not possible for them to augment the reports with other data known to the wider LMS.

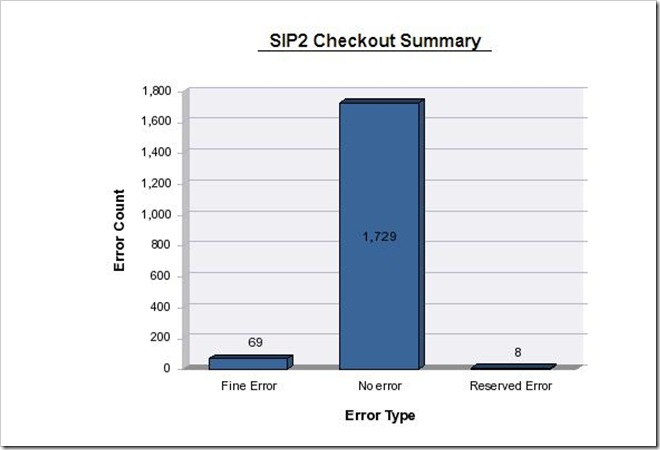
It is however possible in principle (although at present a slow manual process) to combine data from the Talis Bridge logs with other data in Talis Decisions. Here is an example: Bridge 4 

Because the LMS, knows more about the borrower (age, course, active borrowing history for example) and the item (type, format, Dewey etc) it is possible to segment this kind of report much more deeply within Talis Decisions, and start asking questions such as:

  • What is the age profile of borrowers who have trouble?
  • Do we need to improve our library orientation sessions for post graduates (because they have an abnormally large number of failures)?
  • If users fail to check an item in or out, do they normally go away and come back later, request a manual transaction or just give up?
  • Do we need to improve the marking of items where loans are restricted (because we are seeing an abnormally high failure rate for that item type)?

There are lots of possibilities, and for many libraries this might be a “nice-to-have” rather than a “need-to-have”, If you have any views on the usefulness of these data, please do comment on this blog or e-mail me directly.

Geographical Information Systems

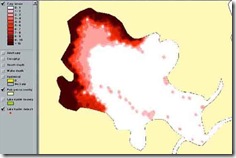
GIS Example A Geographical Information System (GIS) typically overlays a map with a representation of some kind of location-based statistical data – such as customer density  or crime rate. The picture is of carp larvae density in a lake created by the FAO. The city of Denver in the USA actually has a local government website dedicated to GIS.

There are broadly two ways in which GIS’s could be relevant to libraries:

  1. Supporting library management choices. For example, a map overlaid with borrower density based on postcode and/or age group might be helpful in decisions on opening/closing sites or on site-related stock purchasing.
  2. As a service to library customers – especially in business libraries

A colleague recently brought my attention to an example of the latter; a system used in some US libraries providing consumer market data via a GIS. I have no knowledge of the particular system or its supplier, but the principle is interesting.

If you already use GIS in your library in either way (as management information or as a customer service), or if you have views on this, please do post a comment (click on the comment bubble on the top right).

Google Analytics in Talis Decisions

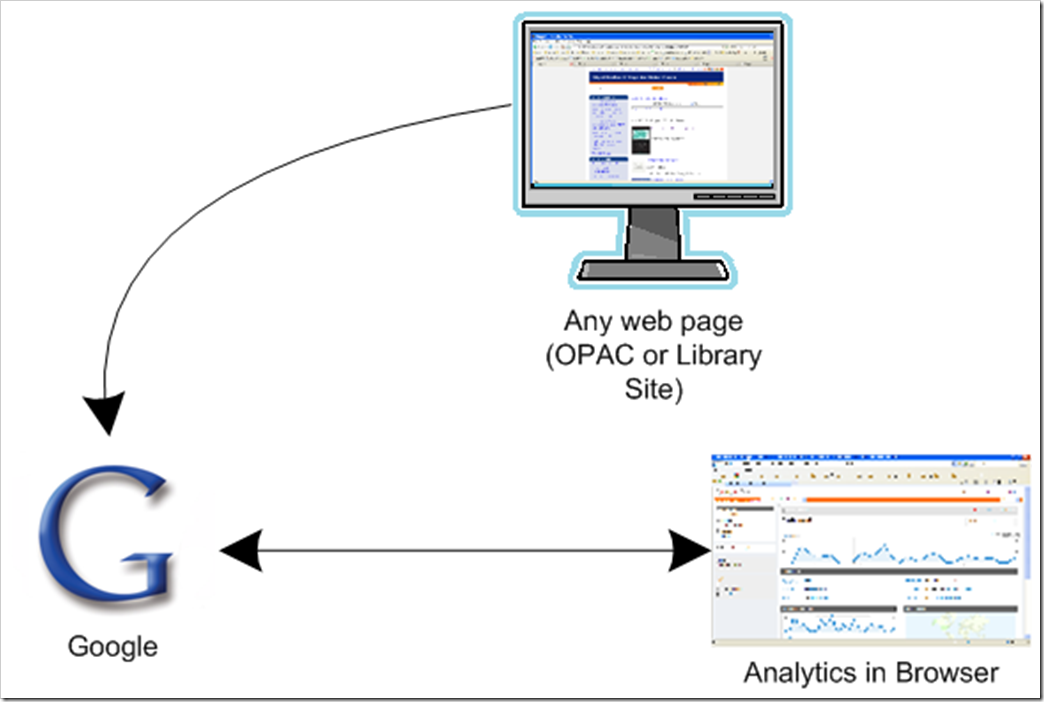
Back in March I touched on Google Analytics. For those who haven’t come across it, the principle is simple. A small module can be embedded in any web page which sends data about use of the page to Google Analytics. An appropriately authorised user can then log in and view aggregated statistics in a browser.GA1

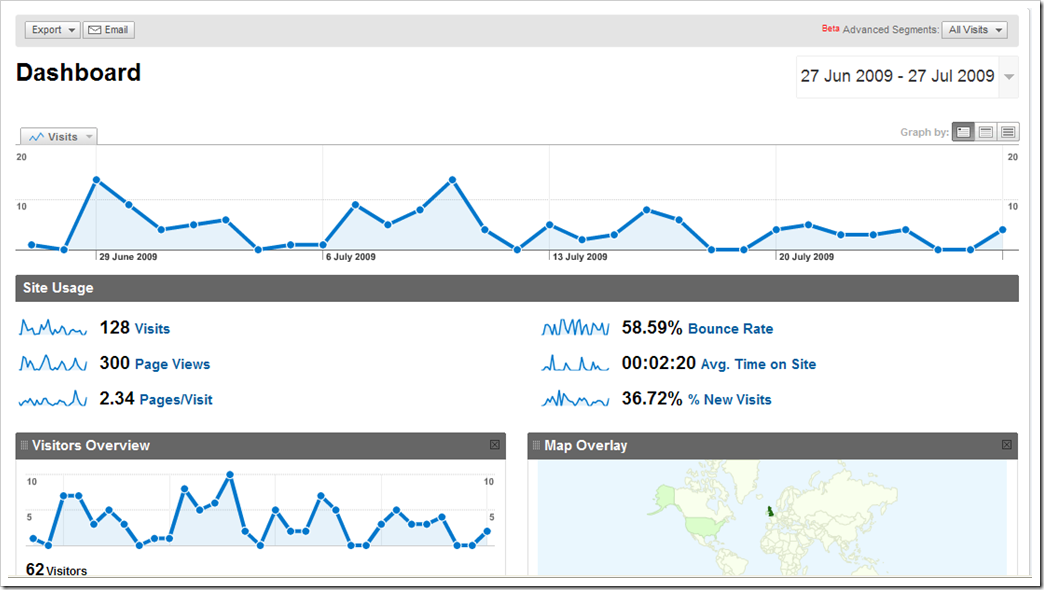
This is an example of Google Analytics report output in a browser:

GA2

The principle is the same as a simple “hit counter”, but Google Analytics offers much more detail. Indeed, one of the difficulties that some folk have with it is seeing the wood for the trees. Just because Google Analytics allows me to track Browser Screen Colour, City of origin and Connection speed, it doesn’t mean that (depending upon my role) I need to pay attention to them all. If total visits or new visits are the only important metric for the job in hand, then the rest is (for me at the moment)  just noise. As ever, the key is to think about what you are trying to do before deciding what information you need to do it.

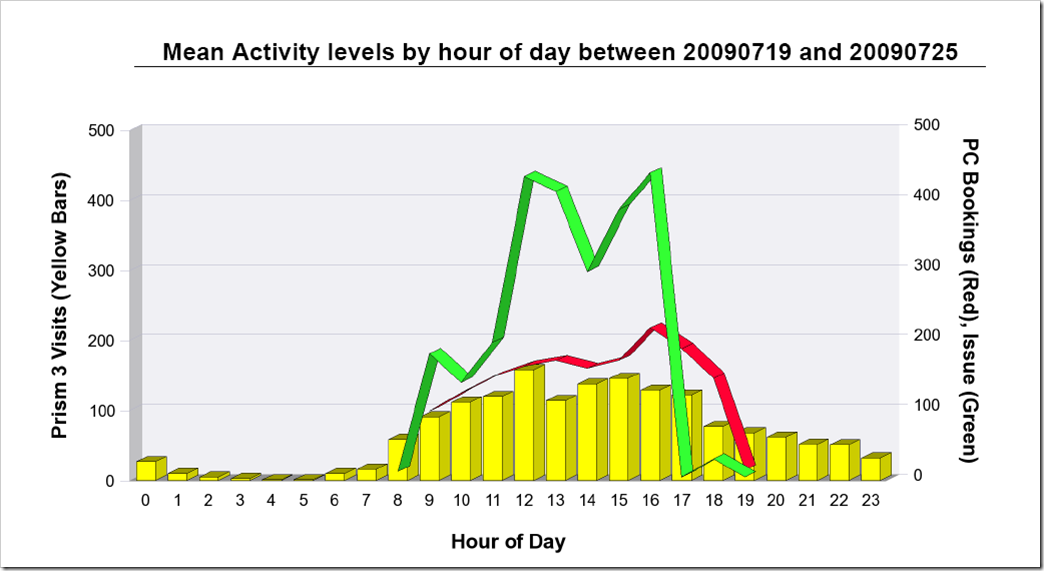
The other consideration is that these data are unrelated to anything else. You may want to see Google Analytics data combined with other data from your library. It is possible to extract the data out of Google Analytics without using the browser interface. Here is a sample report in Talis Decisions combining number of Prism 3 visits from Google Analytics (yellow bars), Netloan data (red line) and Loan/Issue data (green line) showing the average throughout the day by hour on the same chart:

GA3

This report was created using the same approach as that described in an earlier blog. The Netloan and Universe data are from conventional Universe queries. The Google Analytics data was downloaded straight into Microsoft Excel (I used an open source programme: Excellent Analytics, although I have not used it enough be in a position to recommend it specifically).

This approach could be replicated today by anyone with both Talis Decisions and Google Analytics, although updating any reports would involve significant ongoing manual intervention. We could probably simplify access to Google Analytics data from within Talis Decisions if there was sufficient demand for it. Please do e-mail us, speak to your account manager and/or leave a comment if you are interested in pursuing this.

Combining data from multiple Sources

Last week I posted a few examples of reports that combined data from the Netloan and standard universes. Someone has since asked me to talk a bit more about combining data from multiple sources.

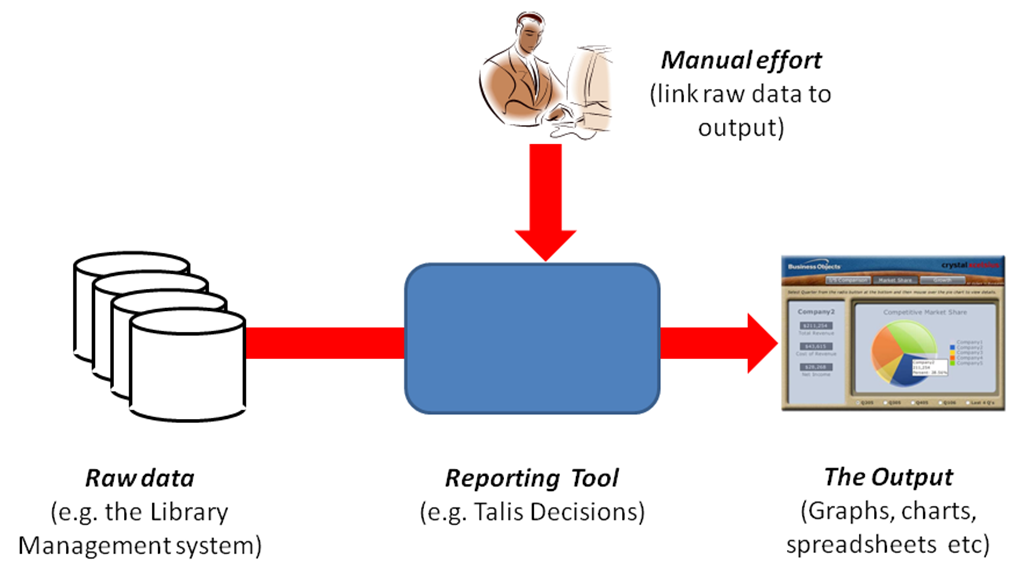
In principle, any Management Information or  Business Intelligence tool works like this:

Generic BI

It is possible to use any of the following to do this:

  1. Self service tools like Talis Decisions
  2. Fixed reports built internally using a toolset like Qlikview, Dynistics or LogiXML
  3. Fixed reports built by a third party like SmartSM
  4. Data warehouses built on powerful (and expensive) enterprise software from companies like Oracle.
  5. Web based service like Pivotlink

In principle all these approaches use this same basic pattern. Most store copies of the data in some form

Manual EffortRegardless of the approach, the devil is in the detail. If your data source is at all complex, it takes significant skilled manual effort to link the raw data to the output regardless of approach. Don’t let a tool vendor tell you otherwise.

Either a third party does this work, in which case the user is stuck with little flexibility, or he/she has quite a lot of work to do before seeing useful output.

Talis Decisions tackles this in two steps in an attempt to get the best of both worlds: (relative) simplicity and far greater flexibility than is possible with pre-built reports

  1. Talis supplies a number of pre-built “Universes” to simplify the process of extracting the data
  2. The user (or a technical intermediary) builds the required reports using the Universes rather than going back to the raw data

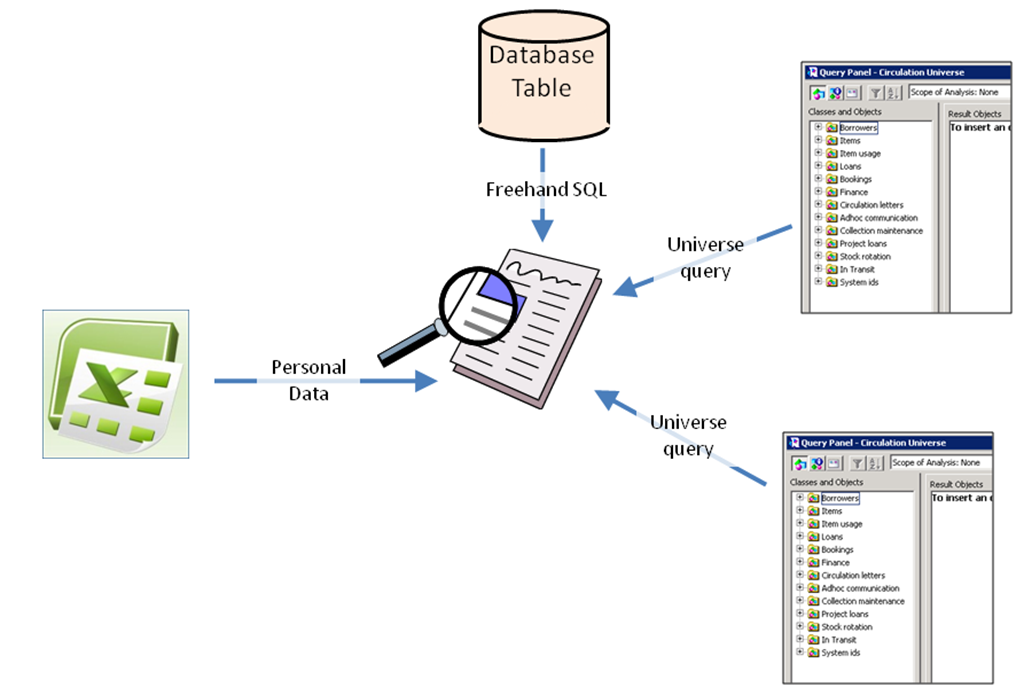
Sometimes however, a user may want to produce a report which contains data from different Universes, or even combine data from a Universe with (for example) data from a spreadsheet on the user’s PC. This was the approach used in the Netloan examples.

A blog isn’t the place to go into a lot of technical detail, but the fundamental approach is to define multiple queries and merge  the results of all the queries in Talis Decisions. There is an article on this on the Talis Developer Network (TDN).

Web intelligence allows multiple Universe queries. Desktop Intelligence also allows the use of local files (“Personal Data”) and “Freehand SQL” (there is a TDN article on Freehand SQL too) which allows you to query the database directly if you wish. Putting it all together, you can create a report combining data from a range of sources:Multiple Queries

The first two Netloan examples just combined two Universes, the third one two Universes and spreadsheet.data..

Netloan Universe

You may have seen the announcement a couple of weeks back about the new Talis Decisions universe and associated files to allow access to data originating in Lorensberg’s Netloan installations.

Here are some illustrations of the kind of reports that can be produced by combining data from the Netloan and Circulation universes (click the pictures to enlarge);

PC Booking Example 1

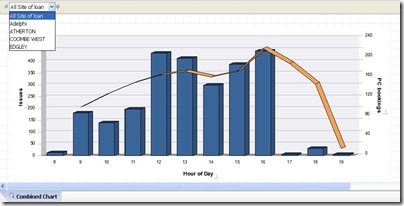
This example plots issues in each hour through the day (represented by the height of the blue bars) alongside the number of PC bookings, also broken down by hour of day (Orange line). Such a report might for example be used as an input to staff planning. The drop-down menu at the top left is a drill filter on the site (at present it is showing all sites, but in principle the figures could be filtered for an individual site).

PC Booking Example 2

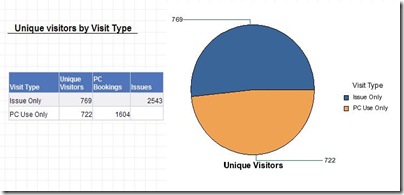
The second example counts the number of unique visitors against the purpose of their visit (item issue or PC booking). In this particular example there was no overlap between the people who came in to borrow something and the group who came in to use the PCs, but the report would be quite capable of showing a third type of visit (“Both”) which would make a third pie segment. This report is more complex to produce (it uses variables for Visit Type and Unique Visitors) but does not require any other special treatment.

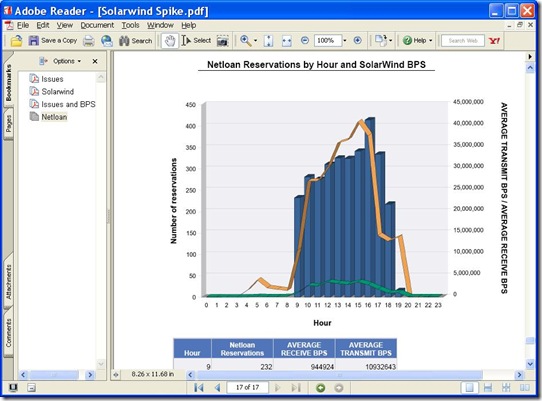
You can also combine Netloan Universe data with spreadsheets or other data sources. Recently, a customer kindly sent me some statistics from their Network Management software. Here is an example (exported as a PDF) which combines these two sources of data (PC bookings and network statistics) in the same Talis Decisions report:PC Booking Example 3The report shows the number of PC booking reservations in each hour of the day (blue bars), the “Transmit” Network traffic (orange line) and the “Receive” Network traffic. This could be useful if you were trying to isolate a problem: in this example there is clearly a big peak in bookings around 4:00 p.m, with an associated peak in network traffic, but another unexplained peak around 7:00 p.m.

Please do let us know what you think of the usefulness of this new Universe: e mail us or just add a comment by clicking on the bubble in the top right of this post.

Zen – Many thanks

Over the last few months we have consulted extensively on the subject of Management Information under the heading of Project Zen.

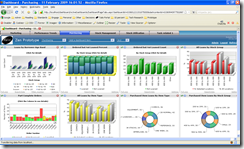
Zen_prototype Screen dumpThis research project was aimed at developing a prototype to validate the demand for a new dashboard-style application for Talis Alto customers.  I want to thank everyone who provided input into this valuable exercise. Our conclusion based on feedback indicates that whilst there is interest in this approach, there would probably not be widespread demand for a product, given the development cost and thus price points. Consequently we will not be moving this research project into a product at this time. 

However, we also found a strong interest in customers getting more value from their current Talis Decisions application, so we will be focusing our efforts in areas such as aggregating additional data sources from related applications such as PC bookings, and reviewing what we offer through Consultancy to help customers set up Business Objects to meet their reporting requirements.