Decisions Blog

Archive for the 'Uncategorized' Category

Performance Management in Singapore

Lee_Kong_Chian_Reference_Library_02

I’ve recently been reading a case study on Performance Management at Lee Kong Chian Reference Library in Singapore: part of the National Library of Singapore.

Singapore recognises that it’s future prosperity depends upon the knowledge-based skills of its citizens. LKC is a reference library and a key success factor for it is the speed and accuracy of answering queries from the public. This is reflected in LKC’s Key Performance Indicators (KPIs)

LKC occupies about 14,000 square metres (about 3 times the area of Norwich Millennium Library, a bit smaller than the new library at Queens university Belfast, and about half the size of the proposed new Birmingham library).

The KPIs tracked by LKC make interesting reading. They include

  1. Visitor counts (including virtual visits – more than 80% of Singaporean households have wireless broadband)
  2. Ratio of compliments to complaints
  3. Number of collaborations (non-commercial partnerships, sponsorships, donations etc)
  4. Number of reference and research enquiries
  5. Elapsed time to respond to queries (in several categories)
  6. Customer satisfaction index (based on survey data)
  7. Number of Promotional activities (particularly collection tours)
  8. Publishing (in house guides, articles, collection guides, book reviews by Librarians etc)

The KPIs persist from year to year: the actual values are revised annually, and tracked by specific reporting.

For many managers, knowing what data to track is itself an issue. Regardless of the relevance of these specific KPIs in other libraries, the overall approach outlined here appears to be very powerful.

Nielsen Libscan Service Rolling Out

Nielsen Book offer a service to the book trade to measure/monitor retail sales of books. This service (BookScan) uses Sales data from bookshops and other book outlets to provide a composite picture of popularity by title and author.

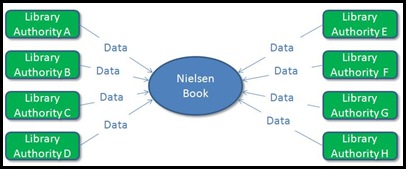
For some time Nielsen have been running a pilot named Libscan (in which at least one Talis library is participating) to do the same thing with Library Loan data extracted from the LMS. They are now on the point of rolling this service out more widely.  Data Download


The principle is simple: participating libraries send in a few fields from their LMS loan data….


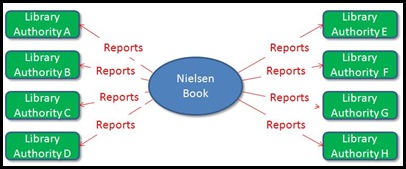
Report Upload


…and in return get reports based on the data.


Loan statistics for a single library could of course be generated using Talis Decisions – and embellished further with a host of other factors such as Borrower age band or issuing Operator. What the Nielsen service potentially provides however is a pan-library-authority view which no single library could generate on its own.

If you don’t use it, you don’t need it

A specialist car engine tuner once observed that many of the road car engines that he was asked to tune for more power were obviously never used to their existing potential as certain bits in their innards were frozen shut from lack of use. These specialist services were very expensive. Clearly much of the expenditure on them is wasted.

In The Know CoverManagement Information is also expensive, and much of the management information that is produced is also wasted. In 2008 the Audit Commission compiled a report relating to the use of information in decision making in the context of public services. The In the Know report contains many gems, but one is the observation that:

“…Information is expensive. …Speed, accuracy, completeness and sharing are all desirable for the users of information, but they all add to its cost. …no one can say how much money is wasted on collecting data or collating information that is not well used or not fully understood…."

And it isn’t just the expense of producing data. I once did some consulting work for a small charity that was, as it turned out, burning around £1500 a month just on staff time to read the “management information”  that they were producing, quite apart from the cost of compilation.

There are, sadly, plenty of high-level examples of poor practice in this area. In 1981 Dame Edith Körner led a working group which recommended the datasets that should be collected and reported on by hospitals. Her recommendations were criticised at the time because there was little or no indication of who was expected to use these data and for what purpose. 28 years later this approach to management information still bedevils the NHS.

The key to avoiding this trap is to start with possible or actual management actions and activities and work back to the information needed to support those actions; but that is perhaps a blog post for another day…

“…conspiracies against the Laity??”

George_bernard_shaw All Professions…” said Sir Patrick “…are conspiracies against the Laity” (The Doctors Dilemma by George Bernard Shaw, Act 1). Most people would however still agree that medicine has been “The Greatest benefit to Mankind

On a smaller scale, performance management methodologies can be regarded as either “a conspiracy against the laity” or “a great benefit”.

There are a number of them around. The Balanced Scorecard is one of the best-known. This has been through several iterations: the classical form however sets a number of targets or Key Performance Indicators (hence “Scorecard”) across a range of themes (hence “balanced”): so for example a library might set objectives relating to:

  • Learning and Growth -  e.g. Assessment of  subject librarians by academics, staff turnover etc….

  • Internal Processes – e.g Self-issue terminal utilisation, number of items bought but not loaned etc…

  • Financial – e.g. Fines collected and waived etc…

  • Customer – e.g. Footfall, borrower retention etc…

The Balanced Scorecard approach is used in libraries. Here for example is some material from the University of Virginia. Please do share your experience via comments if you have experience using the Balanced Scorecard approach in Library management

The Performance Paradox

These two aircraft originally entered service a few months apart in 1944. Which would you suppose to be the fastest?

Meteor Tempest

Surprisingly it is the one on the right, the piston-engined Hawker Tempest, which was 20 m.p.h faster than the first variant of the jet-engined Gloster Meteor. Within a few years, however, later variants of the Meteor were half as fast again, easily outstripping the fastest piston-engined aircraft

perf paradox This is in an example of one of the principle paradoxes at the heart of The Performance Paradox a book about the management of performance. New technology, new ways of doing things, even new procedures open up the possibility of a huge improvements in performance: but when first introduced, may underperform compared with the old.

It is of course easy to use this observation as a smokescreen to hide failed initiatives: but nonetheless real advances may produce a temporary dip in performance management metrics. It’s a useful insight when trying to understand the reason for a reduction in performance where you had expected an improvement.

Use of Talis Decisions for stock Management in Aberdeenshire

There is an article in the latest (Aptil 09) issue of Talis’s magazine “Panlibus” about the use of Talis Decisions reports for monitoring the performance of stock in Aberdeenshire Libraries and Information Service (ALIS).

If you are a user of Talis Decisions and are interested in Stock Management, it is well worth a read as it illustrates both the kind of things that can be done and the relationship between action and information.

If you do not have a paper copy to hand, it will in due coures appear on the Panlibus page. There is also some related material in the Talis Decisions community section.

Doing more with less in the Big Apple

The New York Public Library System is facing a good problem and a bad problem, both related to the economic downturn.

The good problem is rising numbers of visitors (probably augmented by job hunters and free Wifi)) . One recent newspaper article noted “Libraries across the [USA] are seeing double-digit increases in patronage, often from 10 percent to 30 percent, over previous years”

The bad problem however is a $23.2 Million funding cut from July .

How to square this circle? An article in Information Week highlights how the library is hoping to use its new Business Intelligence system to help meet the rising (and changing) demands on it, despite the reduction in staff likely to be required. For example, they might improve the rostering off staff to meet the changing profile of PC usage, private study, job hunting etc in various libraries through the day.

For changing times mean more than ever that good information on what is happening now trumps instinct based on experience of the past.

Checkland and the Battle of Britain

In their book Information, Systems and Information Systems , Professor Peter Checkland and Dr Sue Holwell describe “The Information System that Won the War”. It is a fascinating tale but it has an enduring lesson for anyone involved with information systems.

It is widely recognised that radar (or “radio location” as it was then called) was a decisive factor in the “Battle of Britain” (the major air battle over southern England in 1940). The grossly outnumbered British fighters could be in just the right place (or just the wrong place if you were a German pilot) at just the right (or wrong) time with plenty of fuel and ammunition. The German Luftwaffe failed to gain control of the air so an invasion became risky, so it was postponed… and the rest is history.

But the interesting thing about Checkland and Holwell’s perspective is that the successful use of radar was not a matter of superior technology. German radar was probably more advanced technically. What made the difference was how the British Royal Air Force (RAF) organised itself to make use of the information that radar gave them. In the first world war, fighters flew “patrols” – and if they encountered enemy aircraft a firefight ensued. The Battle of Britain was different. The RAF invented from scratch a whole system of fighter controllers, plotting tables and all the rest of the paraphernalia which allowed the RAF fighters to stay on the ground until the last moment and then fly directly to the right point to attack an incoming raid. But it was the whole system, not just the technology, that did the job.

The most remarkable part of the story was that the RAF had practiced the use of radar data in the air exercises of the late 1930s before radar was even available. They knew what they wanted to do, they knew what information they needed, and they had developed the system to take action on the basis of the data before the key technology piece was even there.

And the moral of the story? Technology is useful, but on its own it doesn’t cut it. Good information is essential, but even that on its own doesn’t cut it. It is the whole system making use of the information to deliver effective action that matters.

Google Analytics

Software like Talis Decisions allows flexible and powerful reporting from Alto data and potentially other data held in the library such as PC loans. However there is another kind of Management Information/Business Intelligence that is of increasing importance to libraries – use of the library website.

I recently came across a short paper describing the use of Google Analytics to improve the design of the website of a specialist academic library. The detailed content is a little out of date but the principles are sound and are relevant to any library.

If you are not familiar with it, Google Analytics is a free service that goes beyond mere hit counters (which just track how often a page is visited). It allows you to monitor things like:

  • when the hits occurred – useful if for example you want to monitor the effect of a marketing initiative
  • How many people “bounce” i.e. come to your site then immediately go off somewhere else (which indicates that they maybe got there by accident)
  • Where your visitors come from by country, region or continent
  • Diurnal spread of visits
  • Average length of time that people spend on your site and the pages they visit
  • … and so on.

As ever, a powerful package like Google Analytics can be used just to produce “fancy that” information (you create the report, e-mail it to a dozen recipients who look at it, murmur “fancy that” – and file it without taking any action): but used wisely it can inform the planning of improvements to a library website or microsite

If you have experience of library website tracking using tools like Goggle Analytics or AW Stats, then please do add a comment sharing your experiences: click on the speech bubble on the top right hand corner of this post.

Fact Not Fiction: Implementing Effective Stock Management

Alyson Hogarth put it in a nutshell: What do we need to Manage?

  • Choice of stock
  • Movement of Stock
  • Deselection/disposal of stock”.

Alyson (from Middlesborough Libraries) was the keynote speaker at the NAG (National Acquisitions Group) seminar “Fact Not Fiction: Implementing Effective Stock Management ” in York yesterday. Most attendees were working librarians and stock managers from Public Libraries, supplemented by a scattering of supplier representatives.

Interestingly, the “how” of managing stock turned out to come down mostly to “Management Information” in the widest sense: information that supports decision-making on purchasing, rotation and withdrawal.

There were supplier presentations from Nielsen Book Data (Bookscan and Libscan), Infor (a technology horizon scan) and Bridgeall (focussing on the new procurement module in SmartSM).

Library-led presentations included one from Joanne Shadbolt of Manchester (ingeniously entitled “A Hitchhikers guide to Galaxy” – a reference to their DS/Axiell LMS), and one from Steve Kettle of Leicestershire Libraries outlining a stock project that they have been running since 2006.

For me, Steve’s presentation was the most interesting of all (and not primarily because Leicestershire use Talis Alto). Their stock project is a co-ordinated effort involving community profiling, market segmentation, promotion/branding and performance management that had a highly professional feel. From the evidence that Steve presented it had clearly worked, both at the level of issue performance (increases in most categories between 2005 and 2008) and in terms of the library’s contribution to Comprehensive Performance Assessment (CPA) outcomes.

The seminar brought four issues into sharper focus for me:

  • The lack of a nationally agreed standard for stock or genre classification, primarily for Fiction.
  • The degree to which management tools presume, presuppose or prescribe a process, and the degree to which they merely inform or supplement existing decision-making processes. This is exemplified by SmartSM at one end of the range (built around a specific methodology) and Bookscan at the other (no assumptions about process).
  • The trade-off in stock management tools between practical and conceptual simplicity on the one hand, and ultimate power and flexibility on the other.
  • The move towards supplier selection

All in all a very interesting event. It will definitely be in my diary for next year