Transit Items
It’s been a while since I last posted: I’ve refrained whilst the switch between a “Talis” blog and a “Capita” blog has been going through. I’d like to restart with a worked example which illustrates some interesting issues.
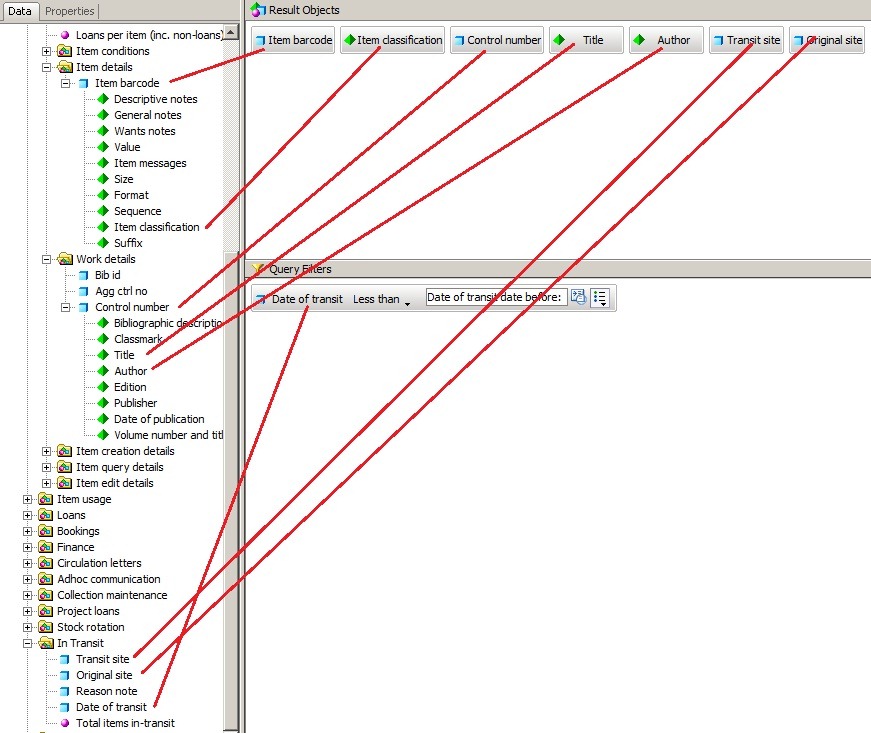
I was asked recently about a report of items that are In Transit and have been so since a specified date. This is on the face of it relatively straightforward. A query like this should do it:
This produces a default report in tabular format:
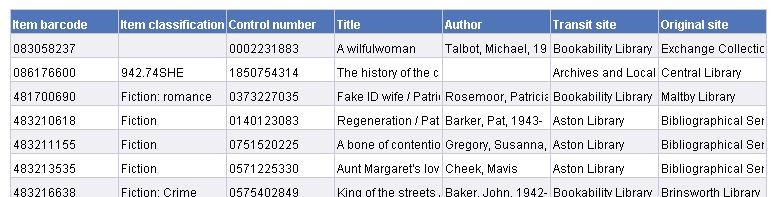
Apart from some resizing of columns, adjusting alignment and word wrapping, this looks close. And it is, in terms of data content.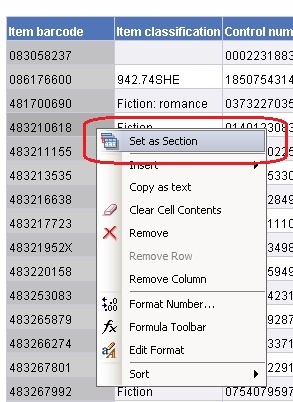
Not in format however. The person requesting the report wanted the output as one small vertical table by barcode, presumably because they were used to scanning data in this format. The first step is to section the report on barcode. A section is an area of the report where everything shares some characteristic: you might for example want to section a report on site, or month in year. There are several ways to create a section. If you already have a table which has the relevant column in it then the easiest way is to right click the column and choose “Set as Section”. In this example we are going to section on barcode.
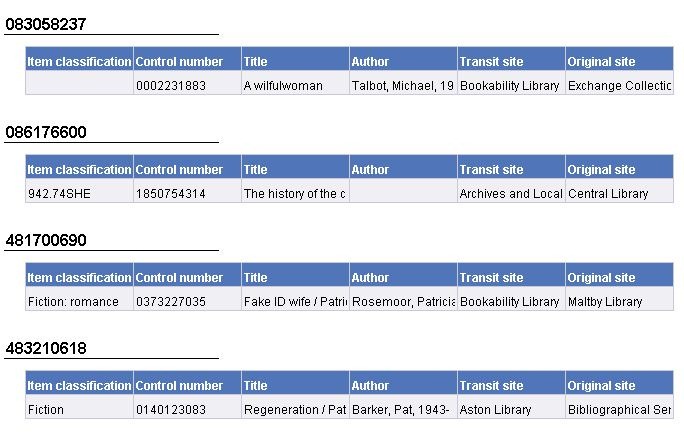
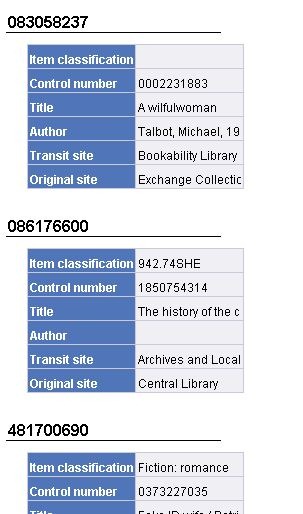
This has the effect of breaking the table up into one section per row with the barcode as a section header:
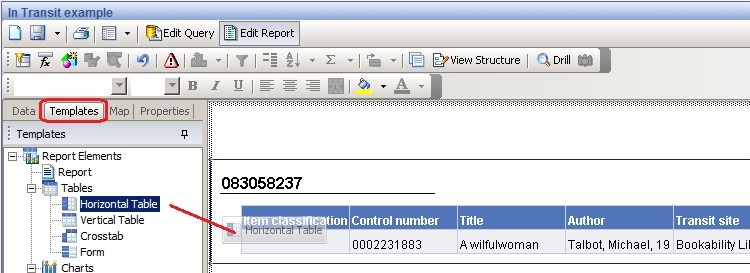
The final tweak is to turn the horizontal table into a vertical one. If you select the “template” tab in the left hand pane and navigate down into the “tables” folder you will find “Horizontal Table”. Drag this and drop it onto the existing table.
This will change the table style into what we want:
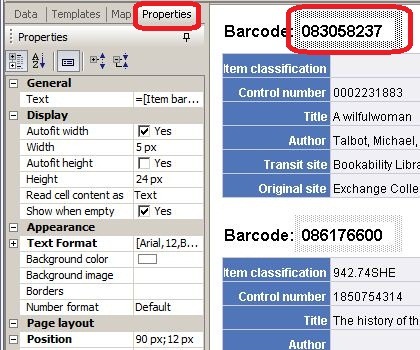
There are a few further changes we can make to tidy up the appearance of the report. The first thing is to drag the right hand edge of the table to give more space for the data. Secondly, the display of the Barcode is a bit messy with an underline far longer than the data. Visual tidying is mostly done in the “Properties” tab with the thing you want to change selected.
The end result after a little more tidying is below. In this example I have
- Turned off the barcode underlining (click on “Borders” in the properties tab)
- Moved the barcode field across to the right
- Inserted a blank text cell before it and typed “Barcode: “ into the cell
- Right aligned the left hand column
- Increased the width of the right hand column
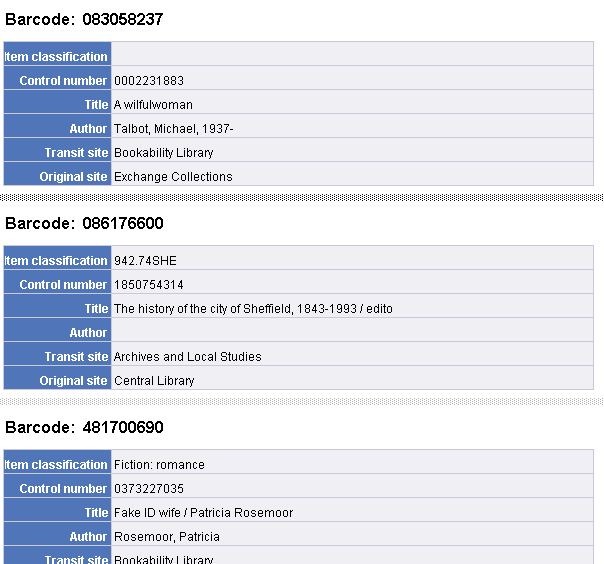
(Note: that the fuzzy grey line between sections is visible because the section boundaries were selected in the editor. They are not otherwise visible).
It is possible to nest sections. In my next post I’ll use this to illustrate sectioning this report on to/from sites.

Recent Comments