Decisions Blog

Archive for the 'Uncategorized' Category

Talis Decisions Examples

A number of users of Talis Decisions have mentioned that it would be helpful to have some examples of typical reports: not so much because one-size-fits-all, but more as a source of ideas and approaches that are helpful when writing library-specific reports.

We have therefore this week published a document containing a number of sample reports describing:

  • What the reports look like
  • How they might be used
  • How they were written

As the document itself makes clear “.. [the document]  is neither a complete tutorial nor a guide to library management. It is intended to stimulate ideas about how to use the core universes to extract information that will be useful in the management of the library.”

We would be very interested in any feedback on the usefulness of this. As ever, please add a comment to this blog, respond via LIS TALIS or e-mail me directly.

Collaborative Decision making

Earlier this year, the well-respected Gartner Group published a research paper entitled The Rise of Collaborative Decision Making. Gartner predict the emergence of a new type of Business Intelligence application that they labelled CDM (Collaborative Decision Making). This appears in essence to be a combination of Business Intelligence and social software (akin to Facebook for example).

This would not be applicable to routine statistics, but might be appropriate to complex on-off decisions such as whether to close a branch, make a major change to opening hours or install self service terminals.

Webi Discussions Talis Decisions already supports this kind of activity to some extent.  At the bottom of the Web Intelligence screen there is a Discussion bar. This can be opened by clicking  on theIcon1 icon.

Once opened, you can add a comment, comment on other people’s comments etc in much the same way as in a forum discussion. The discussion stays with the report. You can reply to other users, or you can reply to everyone.

It is probably fair to say that this facility will be used only occasionally – and at that, only in an environment where there are multiple users: but it is useful to know that it is available if necessary. Judicious use has the potential to save a messy and unstructured e-mail discussion.

Using External data with Talis Decisions

For most people, the main use of Talis Decisions is to extract and display data from Talis Alto. Talis Alto does not however contain data on everything that is known about a borrower or an item. In an earlier post for example I explained how reports could be produced combining PC booking data with Talis Alto data to produce a more complete picture of activity in the library.

The same principle can be used to extrapolate from data that Talis Alto does hold to infer those that it does not. Here for example is a chart that combines borrower postcode data with a postcode-to-electoral-ward lookup table to derive the number of borrowers by electoral ward:

Ward density

This was produced by combining a query on postcode with a sample of lookup data provided by Map-Logic (the base data are © Crown Copyright).

The report was produced in Desktop Intelligence. The lookup data were imported from a spreadsheet:

WardLook up data

(In this example the borrower data were extracted using Freehand SQL rather than a Universe query: I can supply more details on request to anyone interested)

Merging queries on Talis Decisions

TDN1 One thing that users often mention in the context of Talis Decisions is combining data from multiple sources (such as two different Universe queries).

It is worth being aware that there is an article on the Talis Developer Network on this subject. If you are a Talis user, but not a member of TDN, go to http://www.talis.com/tdn/ and request an account:


Once you have received your account details, go back to the same URL and log in with your new credentials.

You will find a number of useful resources here. The article on synchronising queries is in the Library Systems Articles:


TDN2

A new way of doing things?

BusinessObjects (the company that builds the engine behind Talis Decisions) have recently come out with an extension to their product set which appears to offer a step change in the accessibility of management information for certain kinds of enquiry.

What it looks like

Suppose that you have had a complaint from a borrower that the stock at their nearest site all seems very old compared with the stock at the main library and you are trying to establish the facts.

You are using the new tool populated with library data. When you first log on you are presented with a search screen not unlike Google or Prism 3. You type in item creation and hit Search:

BO Explorer Search The software returns matching  “Information Spaces” ranked by relevance. Note the ranking score on the left. You decide that the first one looks most promising so you click on it. This is what you see by default:

BO Explorer Default

Forget the top panel for a moment; look at the bottom one. One click from a Google-style search and you are half way to your answer. By default it has given you the number of items at each branch – not exactly what you want, but getting there.

Note (and this is where the real power comes in), the graph at the bottom isn’t just a picture. It changes on the fly as you select different alternatives. The graph at the moment shows total items by home site. You want it by year (of creation), so you select that option in the drop-down:

BO Explorer X-Axis selection

The graph refreshes with the new data in less time than it takes to read this sentence

Lets suppose that the two sites that we are comparing are the Central Library and Maltby Library (the sample data set in this example is from a public library but the same principle would apply in an academic library). You click on Central Library in the top part of the window and also select the sort order you want (decreasing year) in the summary table on the right:

BO Explorer Central Library

Change the chart type if you wish (e.g. to a pie chart), export it, and then click on Maltby Library, re-export and you have your evidence in a form that you can paste into a letter or post on a website.

Note what has happened here. In four or five steps you have got the information that you need. No one has had to write a query or understand the database. The formatting of the report has been largely automatic. Above all it has been immediate. There is no sitting around waiting for reports to refresh.

What might it be good for?

Experience would be the final arbiter, but it looks like this tool is ideal at digging down into data, Here is an example showing the numbers of adult and child fiction items at Maltby library in any state other than In Stock (look at the selections at the top):

BO Explorer type status

It seems probable that this would be very useful in three kinds of situation:

  1. There is some unexpected or anomalous figures in routine reporting and you are trying to establish why.
  2. You are doing some what-if planning, perhaps (for example) around site closures, opening hours or supplier performance.
  3. There has been a Freedom of Information (FOI) request for something not reported routinely (e.g. number of cancelled ILLs at someone’s local site).

What it probably isn’t good for

The tool is clearly oriented for ad hoc, interactive use. There are several things that would probably still be better done in Desktop Intelligence or Web Intelligence. In particular it is probably not ideal for:

  1. Long lists used for operational tasks (e.g. items that haven’t been issued for a while and are therefore candidates for withdrawal)
  2. Routine reports that are scheduled to run at particular times and/or are distributed automatically to a number of recipients.

Under the bonnet

The technology is an example of in memory analytics. “Information Spaces” based on new or existing Universes are created as part of the tool set-up and refresh automatically. This creates an index file. When the end-user clicks on an information space, the index file is loaded into memory and can thereafter be used interactively. The same principle is used in tools like Qlikview

What do you think?

On the face of it, it might be possible to integrate this into Talis Decisions. We would have lots to do (for example to check that it wouldn’t overstretch the hardware that most users have), and we are right at the start of the process. It would however be very interesting to know whether you would judge something like this to be potentially useful.

Please can you let us know (by adding a comment) whether in your opinion, this kind of capability might be:

  1. Extremely useful
  2. Fairly useful
  3. Possibly  useful
  4. Not something you would use much
  5. A fun toy but hard to justify
  6. Irrelevant
  7. {Anything else that you would like to say}

This is just a rough initial straw poll. We shan’t hold anyone to their opinion(!)

SCONUL Performance Portal

Very often, what to measure can be as problematic as how to measure it. This is an area where the sharing of good practice would seem to have much to commend it

It is mostly relevant to academic libraries, but SCONUL (Society of College, National and University Libraries; well known for it’s collection of statistical data) also has a Performance Portal launched in June 2007. This was an initiative of the SCONUL Working Group on Performance Improvement. The portal has a number of sections intended to disseminate good practice in the management of library performance. There are sections on survey tools such as LibQual. There is also one on Key Performance Indicators (KPIs), although as yet there is little detail in this area of the site.

The principle seems admirable. If you have any experience of performance management in an academic or public library, please do comment on your experience of the practice.

The future of Business Intelligence – what does it look like to you?

A recent article in Information Week identified four key issues (they called them “technologies” but they are more than that) in commerce and industry at large (not just Libraries):

  1. predictive analytics,
  2. real-time monitoring,
  3. in-memory processing,
  4. Software as as Service (SaaS)

Predictive Analytics uses data from past events to attempt to predict future ones. This would apply to things like automated assessment of mortgage applications or insurance claims in order to assess the likelihood of default or fraud. Real-time monitoring cuts the time taken to get relevant data to a decision maker in time to intervene whilst events are unfolding. A speedometer in a car is a very simple example. A more complex example: the doctor in charge of an Accident-and-Emergency unit might have a  display which alerts him/her to patients who are at risk of breaching the four-hour waiting-time target.

I cannot think of situations in libraries where either of these would be cost effective: it would of course be nice to be able to predict (say) next year’s loans or active borrower count, but the usefulness and statistical validity of such predictions would be questionable.

What is your view on this? Do you think that these capabilities have a place in the library world? Can you imagine likely scenarios or examples? Please use the comment facility to add your ideas.

The second two (in-memory processing and Software as as Service) are more promising. We looked at the Software as a Service model last year as an adjunct to Talis Decisions. It didn’t seem wholly cost-effective at that time, but it is an area that we are keeping under review. We are in the early stages of evaluating a possible in-memory extension to Talis Decisions. This might allow a more interactive style of “what-if” reporting.

Again, please do let us know what you think. Do you see a place for either of these in practice in the library world? If they were in place, what kind of things would you do differently?

Self-Service Terminals reporting

In recent months, a number of folk have raised questions about reporting around the usage of Self-Service terminals. There seem to be a couple of issues; What (to report on, regardless of means) and How (at a technical level). In this post I’ll attempt to set out some ideas on both.

What to report (and how to use the reports)

As ever with management reporting, the best place to start is what outcomes are considered desirable, and what management actions the recipient can actually take to achieve that desired end. The desirable outcomes are in this case fairly intuitive: to increase efficiency whilst maintaining staff morale and retaining borrowers. Actions that management can take might include:

  1. Make changes to Self-Service Terminal siting
  2. Make changes to staff planning (e.g. more staff on when manual transactions high, fewer when self-service transactions predominate)
  3. Make a change to opening hours (e.g. if it is found that the use of self service holds up later in the evening)
  4. Make a business case for more self-service terminals
  5. Take steps to re-activate customers who may have been scared off by the introduction of self-service.
  6. Reassure staff
  7. Organise staff training in the use of staff pads (workstations) or in encouraging borrowers to switch from manual to self-service transactions
  8. Run experiments (e.g. assigning a staff member or volunteer to hover around a group of self service terminals at peak times to help Borrowers get over the initial techno-fear)
  9. Organise undergraduate education
  10. etc. etc. Please do add other ideas as comments

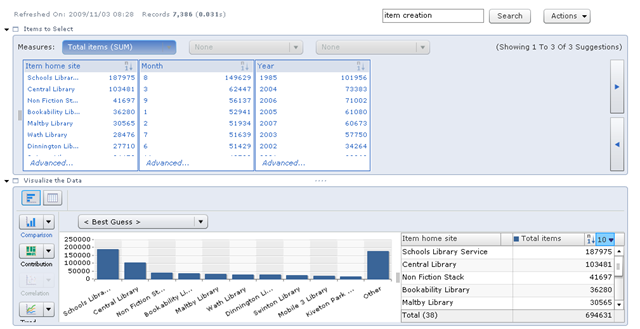
Many of these actions can be supported by monitoring transaction volumes by site and by terminal in a given time period. There are many ways that these data could be displayed. Here are some examples:

Self Serve 1

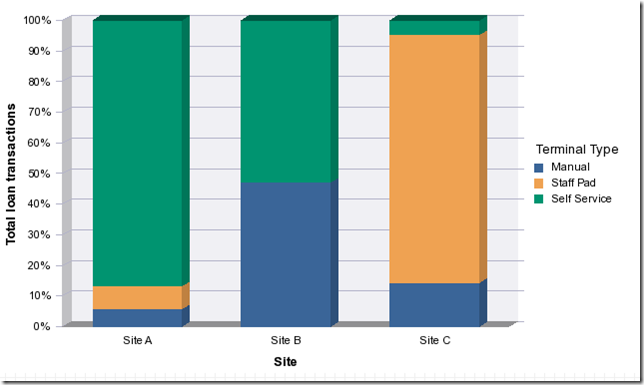
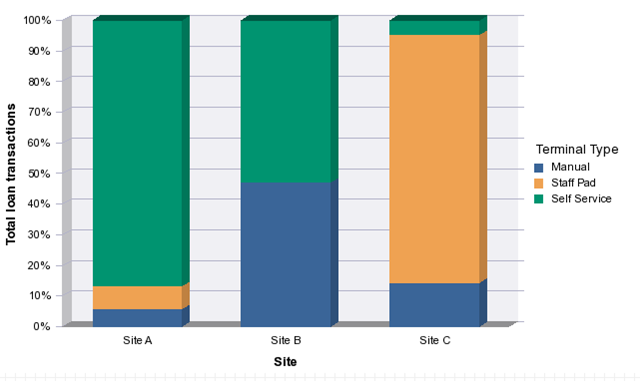
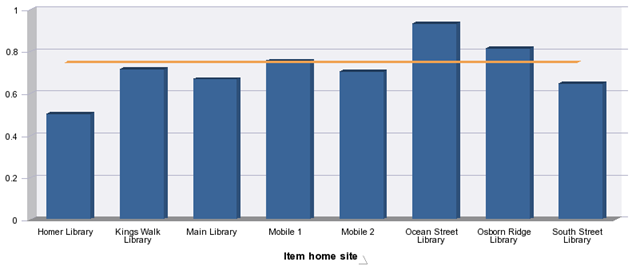
This first example gives an overall feel for the extent of Self Service Terminal utilisation by site

  • Site A shows a healthy pattern : Staff Pad (Staff Workstation) and Manual transactions are low
  • Site B does not have a Staff Pad (or if it does, it isn’t being used). Also it either has insufficient terminals, or the terminals are being underutilised
  • Site C is quite out of balance. The self service terminals are little used

Self Serve 2

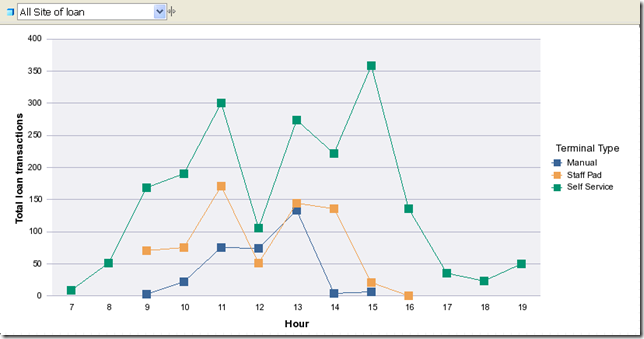
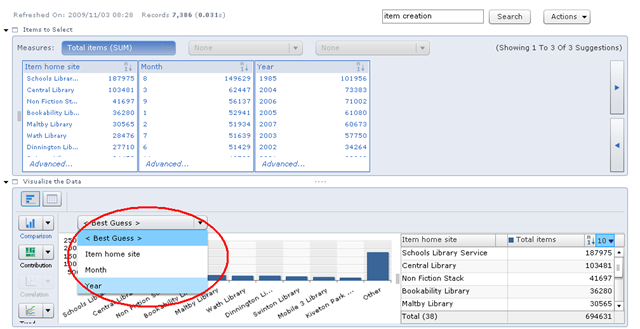
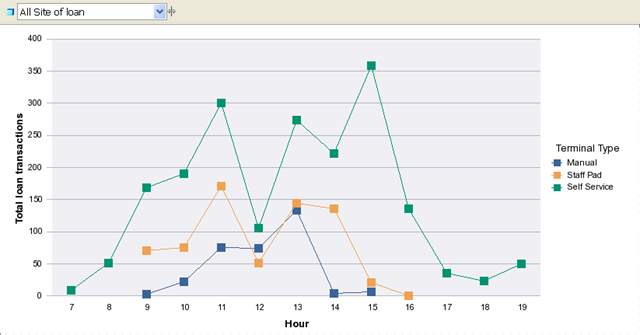
This example shows the number of loan transactions by hour of day through the day. It might feed into staff planning.

  • The peak in Self Service transactions around 3:00 coincides with few staff issues at that hour . This might bear further investigation. Are the staff busy on other tasks? Have afternoon lectures just finished or a local school just come out?
  • It also looks like this site is open for self-service issues longer than for staff issues. The slight rise in self-service issues around 19:00 (7:00 pm) suggests that if the site was open until (say) 9:00 p.m. then issues might continue.
  • Note too that I’ve added a drill filter on the Site of Loan to this example (top left). If you select a site in the drop down, the chart redisplays with just the data for that site. (This is of course not available when viewing the report in Excel or PDF).

Self Serve 3

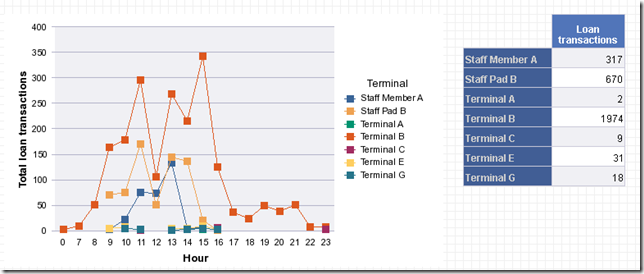
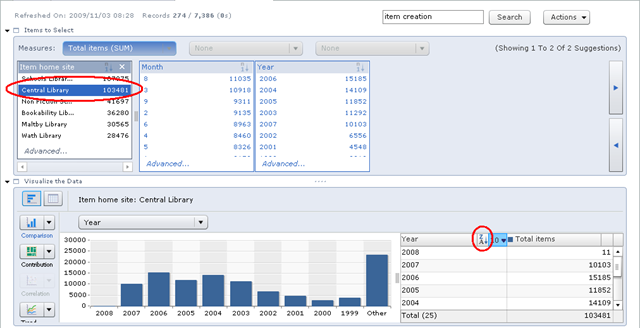
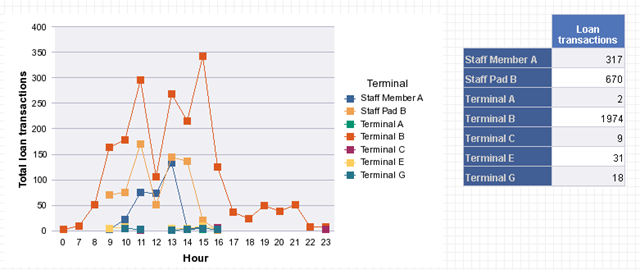
This example shows the utilisation of individual terminals, staff pads and human operators by hour of day. You might want to add a drill filter on the site if the number of terminals is large.

  • It is pretty clear that most of the terminals are under utilised. The issues at terminals A, C, E & G together add up to only a few percent of the issues at terminal B.
  • Those issues that do occur at the less-used terminals all seem to occur in the morning: they are hardly used at all after 2:00.
  • It would be worth asking staff to monitor Terminal B between 1:00 and 3:00 to see if there are frequent queues at it. If so, it may be worth putting a notice on it like “There are more self-service machines located…”

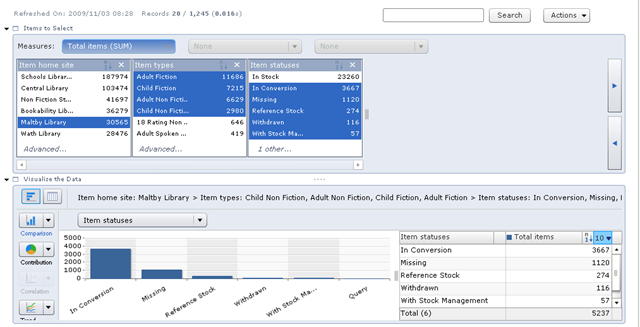
These examples are not exhaustive. For example, Borrowers who lapsed around the time that terminals were introduced and who never used self-service terminals might be candidates for a marketing effort emphasising that help is available to learn how to use the new terminals, and that the old issue procedure are also still available.

How to do it

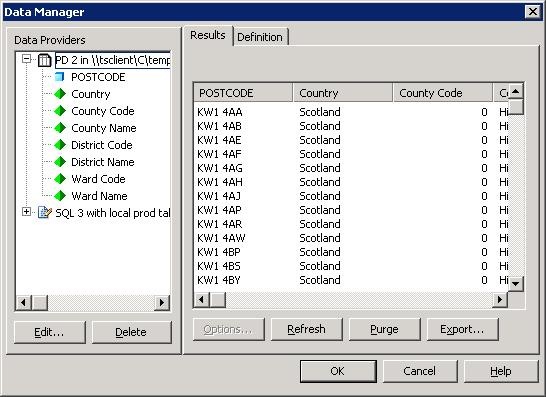
Again, there are a number of ways of generating reports like these. There is one key issue however – in order to get data down at the level of the individual terminal, it is essential that each terminal and staff pad have it’s own unique operator ID, and that these operators are set up in Talis Alto. Any Operator IDs that are not set up within Talis Alto will not show up in the Talis Decisions reports, even if they are configured correctly in Talis Bridge  At the end I provide an alternative partial solution if these are not set up correctly.

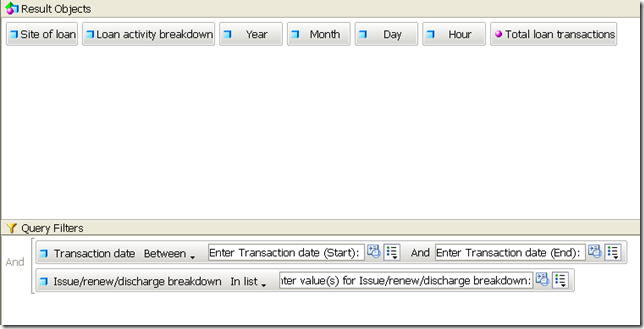
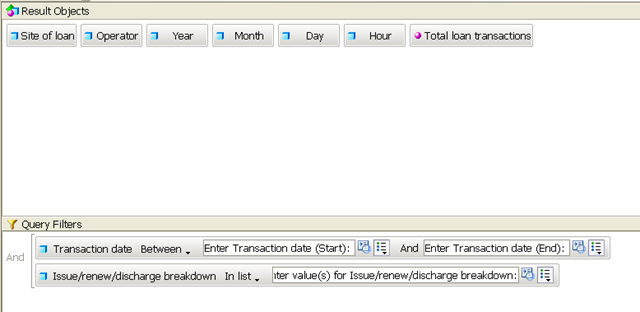
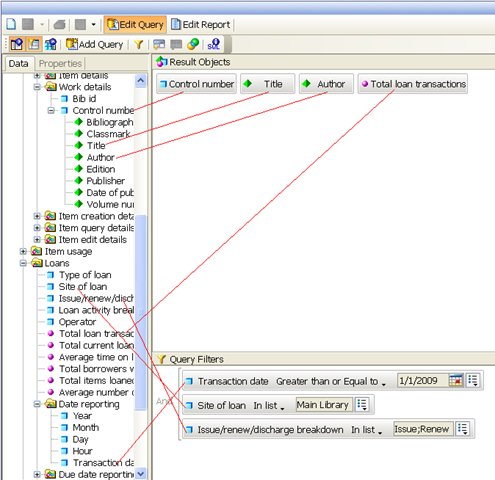
The three examples above were all individual report tabs within one Talis Decisions document. This was done using Web Intelligence in Talis Decisions XI Release 2. All three reports were based on the same single query. The core of such a query might look like this:

Self Serve 4

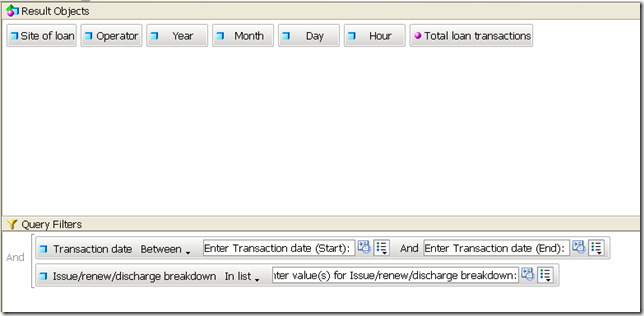
You can embellish the query with item and/or borrower details, but the query will take longer to run, as for each loan a look-up will be required on the linked item and/or borrower data.

It is usually essential to restrict the date range for a query like this. If the query is run with no date filter, or for a very long period, the query may take a very long time to run and might not complete at all. If despite restricting the date range to (say) a week, the query still takes a long time to refresh, it would be worth raising the issue with your account manager, because this may indicate an issue with your Talis Decisions set up.

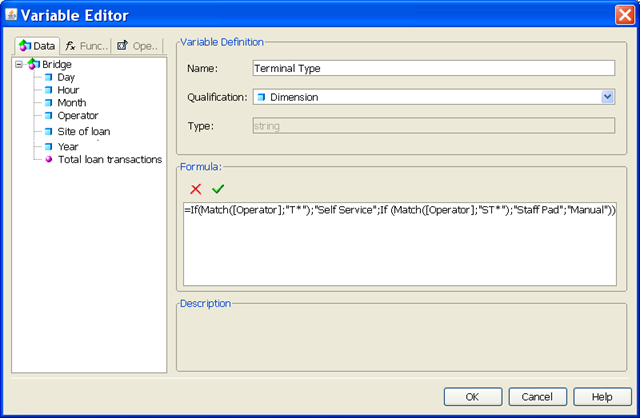
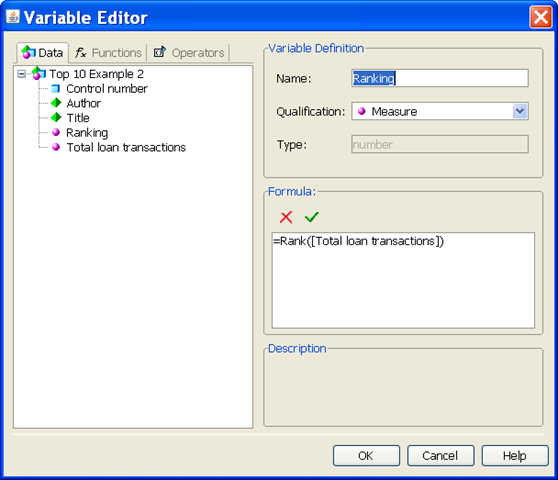
You will note above that there is reference to a Terminal Type. This is not data extracted by the query; it is a variable that uses data from the query. The basic principle is to say that if the Operator ID is in one range (or one set of values), it is a self-service terminal. If the Operator ID matches another set of values, it must be a staff pad etc. The variable is defined in this way:

Self Serve 5

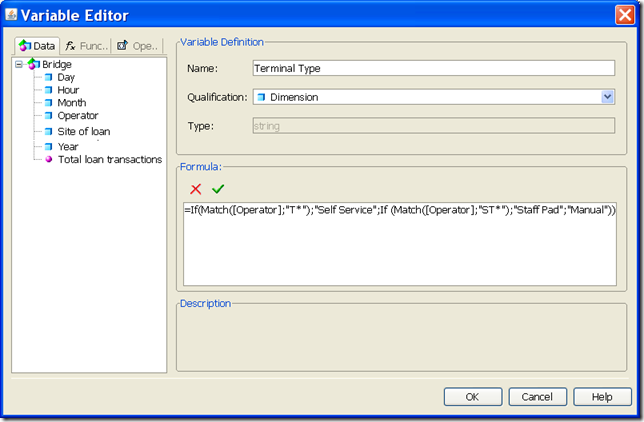
The variable formula used in this illustration is

=If(Match([Operator];"T*");"Self Service";If (Match([Operator];"ST*");"Staff Pad";"Manual"))

This example assumes for illustration that:

  1. all the self service terminals are configured so that the operator starts with a “T”, that
  2. all the staff pads are configured with an operator that starts  “ST” and
  3. anything else is assumed to be manual.

You would of course have to amend this formula to suit the terminal configuration in your library.

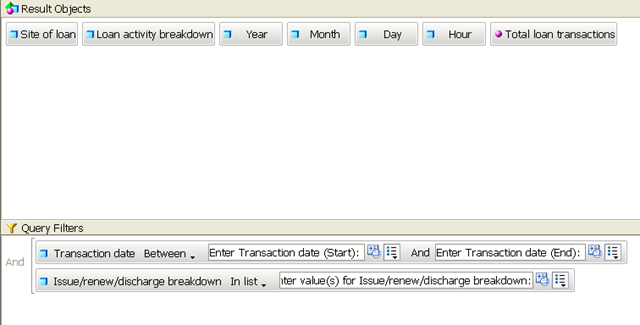
If your terminals are not configured with unique operator IDs, or if the operator IDs are not known to Talis Alto, then an alternative which will give you some information is a query like this:

Self Serve 6

The Loan Activity Breakdown returns values such as

  • Child project loan
  • Housebound
  • Manual discharge
  • Parent project loan
  • Public renew
  • Seen issue, renew or discharge
  • Self-issue
  • Unseen renew

The exact values may vary from library to library, but the underlying codes are the same: all SIP2 transactions (apart from Talis Message) will have a LOAN.ACTION_ID = “CLIS” which will probably be labelled “Self-issue”.

What Can’t be done currently

Only successful Self-service transactions are recorded in Alto. If a user tries fruitlessly to self issue an item, fails, gives up and goes away in frustration without telling anyone then Alto will not have a record of it. The Talis Bridge logs do contain data on failed transactions and it would in principle be possible to extend Talis Decisions and Talis Bridge to allow reporting on failures.

Is this something that you feel is important? If so, please help direct the Talis Decisions and Talis Bridge roadmaps by commenting on this post enabling us to gauge demand..

Any other comments/suggestions based on your needs or experiences with self-service reporting would also be most welcome.

Top 10 most popular Works

I promised to illustrate an example of a Talis Decisions report on the top 10 most popular works. Here are a couple of ways of doing it. I am indebted to Sharon Jamieson of Aberdeenshire Library and Information Service (ALIS) for the second  of these; the ALIS example uses Talis Decisions XI version 3. Both examples use the Circulation Universe.

Example 1 – Simple example based on the current version of Talis Decisions

XI 2 Query This example has been pared to the minimum: the queries are hard coded (you could use prompts) and item types plus Dewey have been ignored. This is the query showing where the objects are found in the Universe:


XI 2 Results 1 The default report is used as the basis (all that has happened here is that I have tidied up the heading and the column widths):


The default report contains all the loan records: i.e. no ranking. You can use the Ranking option as described in the second example. An alternative approach (used for illustration) is to create a Ranking variable and use that. The steps are as follows

XI 2 Ranking Variable Create a variable. You can call it anything that you like: I called mine Ranking. Set the variable equal to =Rank([Total loan transactions]).


XI 2 Sorting Add this variable to the table, sort on it…


XI 2 Ranking Filter … and finally add a filter to the table to display only those records where the ranking is less than or equal to 10.


XI 2 chart It is possible to produce the same data in graphical form, although the detail of this is probably a bridge too far if this post is to be kept within reasonable bounds.


Example 2 – from ALIS (Talis Decisions XI 3)

The ALIS example uses the same basic approach but adds more data and uses a more sophisticated way of reporting the results for different Item types

XI 3 Query

Here is the basic query (click on it for a larger view). The Results Objects (top right) are

  • Item Types
  • Control Number
  • Author {Control Number Detail}
  • Title {Control Number Detail}
  • Item Class mark (Dewey) {from Item Conditions}
  • Total Loan Transactions


The Query Filters (bottom right) are Issue/Renew/Discharge breakdown In List Issue:Renew , Transaction Date Greater than or equal to {Prompt} and Site of Loan In List {Prompt}

There are actually four reports (each with its own tab) in the document:

  1. A Main report containing everything
  2. Top 10 Books
  3. Top 10 DVDs
  4. Top 10 Talking books

Clearly the exact subdivision will vary according to local preferences.

XI 3 new report pop up

Running the query will add a default report (tab). You can add additional reports by right-clicking an existing one and choosing "Insert Report”:


XI 3 Filter2 Each report, (or a section within the report – authors choice) has a filter. This is accessed by clicking on the filter button (red ring), selecting the block or section you want to filter and dragging the data item that you want to filter on into the filter area (red arrow).

NB – this is different from the query filter. In Talis Decisions you can filter both in the query (this limits the scope of the raw data available to the report) and on elements in the report itself (which limits the data actually displayed on the selected block – table, section or report tab).1

XI 3 output

In the ALIS example, each of the “Top 10” report tabs has several sections based on Item Type: so for example the Top 10 Books tab has a section on Item Types with a filter on the section limiting the Item Type to Book or Reader Development Book. The result is that there are two tables on this report tab – one for Book and one for Reader Development Book on this tab

XI 3 Rank

The report so far will not have just the top 10 in it, but all records. In the latest version of Talis Decisions, you can select a table and use the Rank dialogue to limit the results returned just to the top 10.


Beware!

There are two potential traps with both examples. The first relates to the size of the query. For this report to run in a reasonable length of time, the (Loan) Transaction Date should be included in the query filter and must not be set too long in the past. If in a large library you attempted to run this report over (say) five years, it would probably run for a very long time. If limiting the date does not have any apparent effect on the time that the query takes to run, then there is probably an issue with your Talis Decisions installation (such as a missing index): you may wish to contact Talis for more help.

The second issue relates to accidentally excluding data. In the first example, the inclusion of Item Class mark from the Item Conditions class in the query will limit the data returned to items that have a Class mark. If an item doesn’t have this, it will not appear in the results. This may not be an issue for you but can be a problem if your data are incomplete.

Note too that ALIS reported an obscure anomaly with timeouts in the software. This may not be general, but their experience was that the query as described ran with no problems in either Desktop Intelligence (Deski) or Web Intelligence Rich Client: but if using Web Intelligence within Infoview the query timed out if the Ranking was used with the Site of Loan in the Query filter. It was OK with either one, but not both.

This is a long post, but even then can’t substitute for formal training materials. Please do let us know (by commenting on this blog, or e-mailing me) whether it was useful. For more information on how to use Talis Decisions, see the Training and Videos pages of the website. The Videos page for example has a 5 minute introduction to filters.

Key Performance Indicators in Libraries

Key Performance Indicators (KPIs) are a term which is used a lot in the context of Management Information. I have mentioned them in an earlier post in the context of the “Balanced Scorecard”. I also listed the KPIs used by the new Lee Kong Chian reference library in Singapore.

KPIs are important for report design in that, in an ideal world, most standard reports in the library would have an implicit or explicit link to a KPI or KPIs.

KPI_Example Indeed it is possible to design a report that superimposes a KPI onto data. Here is an example (created using Talis Decisions) showing a KPI (Orange line) superimposed on actual Library data (Blue Bars). As a matter of style, it is probably appropriate to link  the KPI value to a prompt to remind all concerned that the KPI value may change even if the thing being measured does not (so for example, there might be a target number of loans every year, but the actual value will change from year to year)

Many organisations suggest target KPIs for libraries: I’ll review some in a future post.