Decisions Blog

Using Sections for Segmentation

It is sometimes helpful to produce a report that is segmented or subtotalled on some value or range. This example illustrates how to segment a report based on classmark.
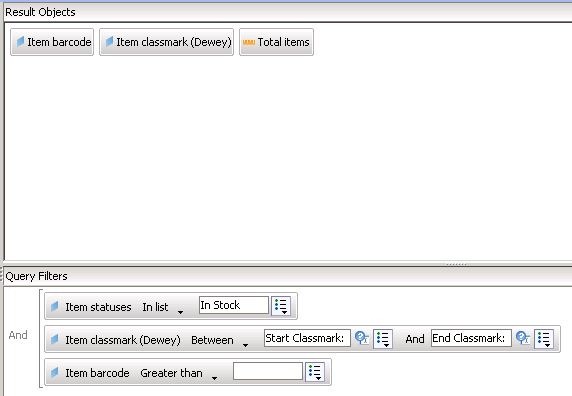
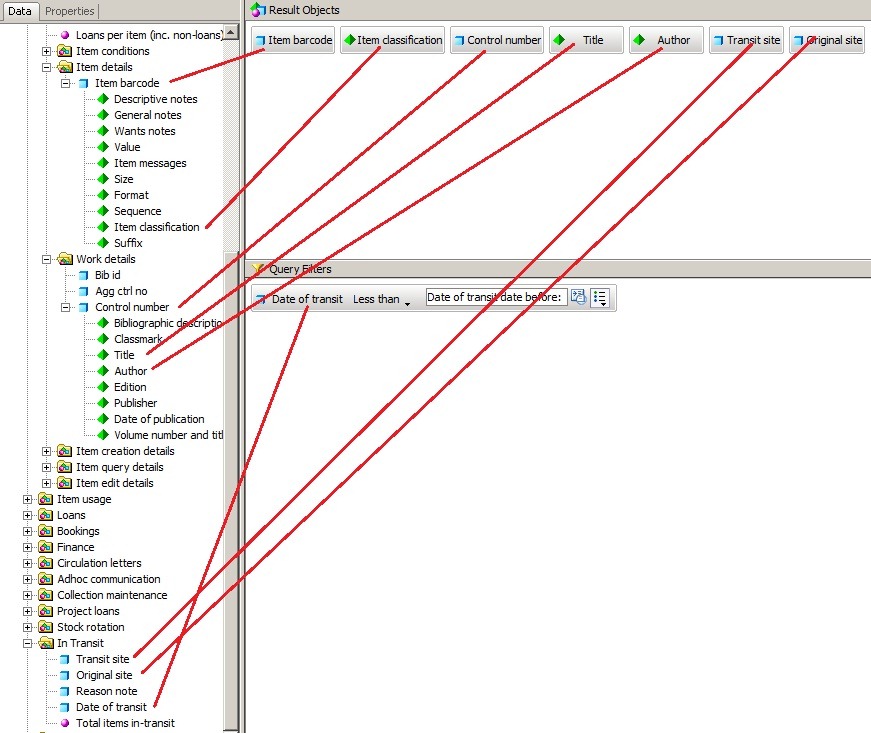
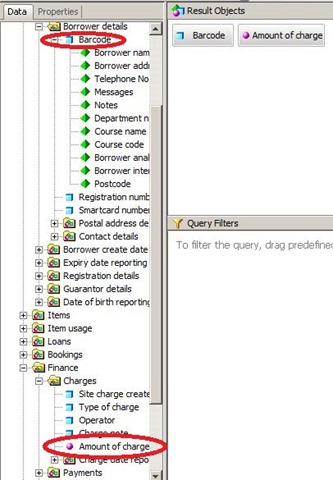
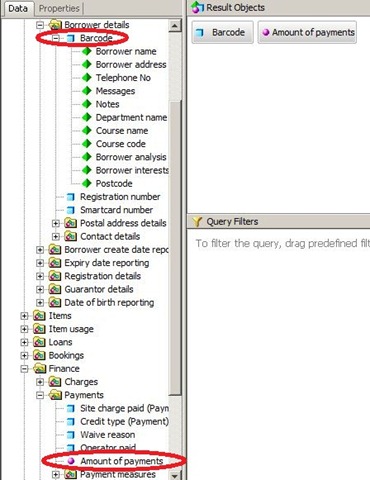
The Query

This should  return, as a minimum, the classmark and number of items in the classmark. This example also returns the barcode so that we can do a detail report tab with the actual item barcodes listed.

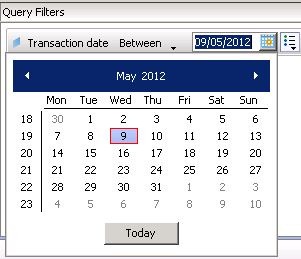
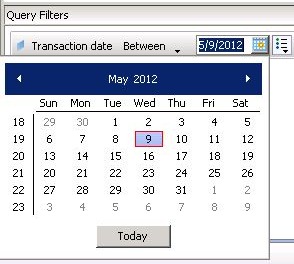
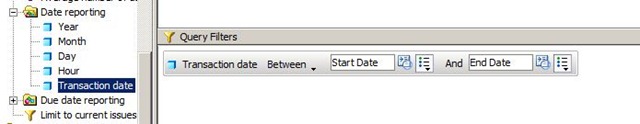
The query should be limited in some way for performance reasons, otherwise you would be counting every item in the database. In this example I have limited the query to in stock items. I have also added prompts for start and end classmarks. The start and end classmarks are only used for performance reasons – they are not used in the segmentation. Finally I have added a filter to return only barcodes greater than a single space. Note that I am assuming that:

  • All in stock items have a barcode. If this is not true, this query will miss some items
  • I’m not interested in anything with no classmark. This query will not return anything with a null classmark, no matter what ranges are used.
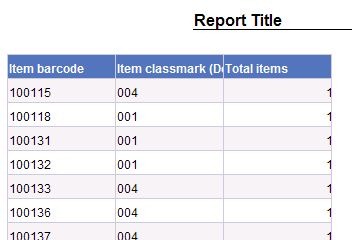
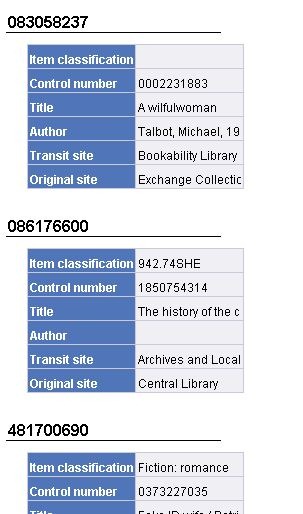
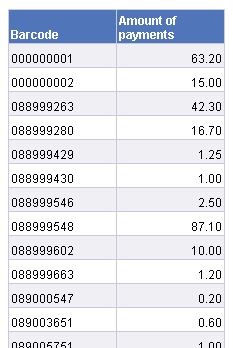
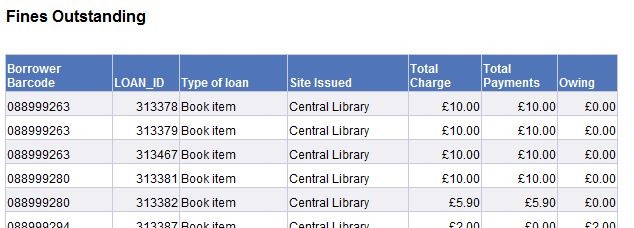
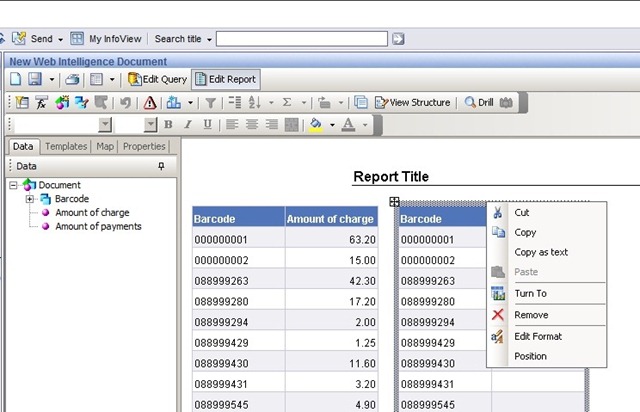
Query

The Report

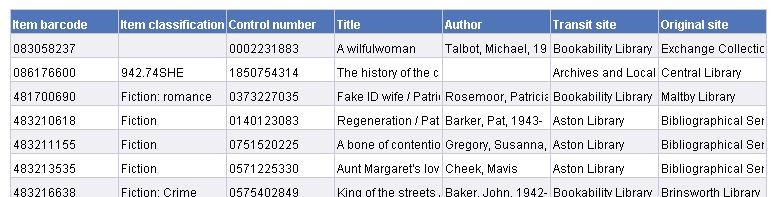
Running this query for the first time produces the usual default report:

default report

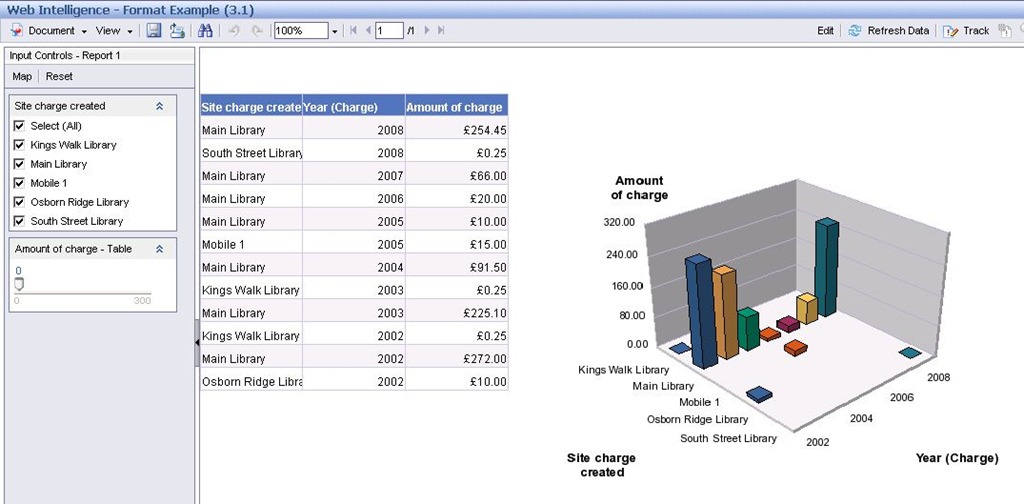
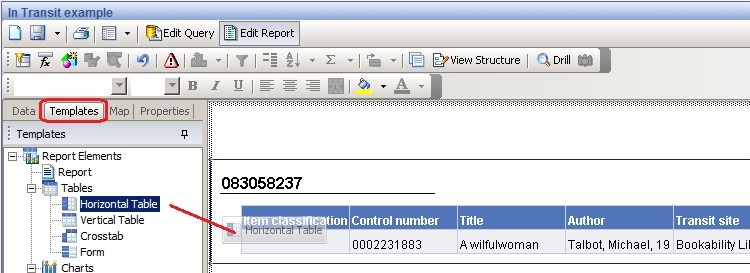
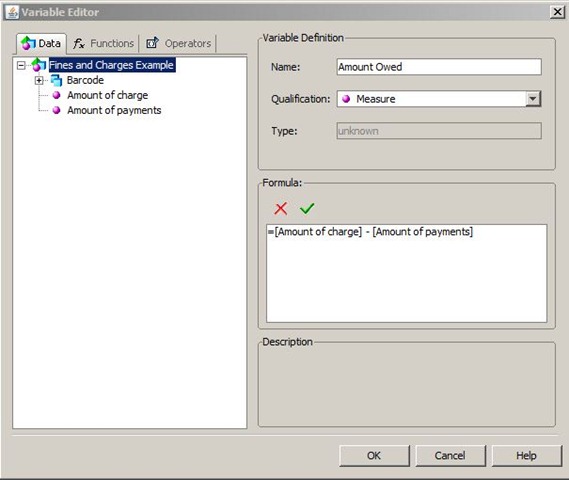
In this example, we want to segment the data by classmark group i.e. 000 – 009, 010 – 019, 020 – 029 etc. To do this we will create a variable which I’ve  named Classmark Group which is the two leftmost characters of the classmark (the name of the variable isn’t important and you can adjust the granularity by making it the three leftmost – or one leftmost characters). The variable definition looks like this:

variable 1

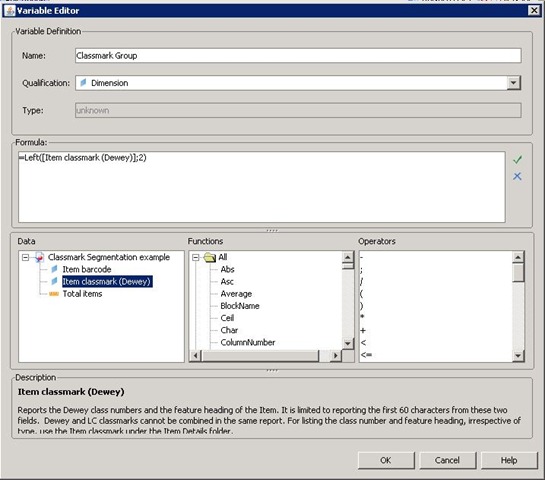
The actual formula is:

=Left([Item classmark (Dewey)];2)

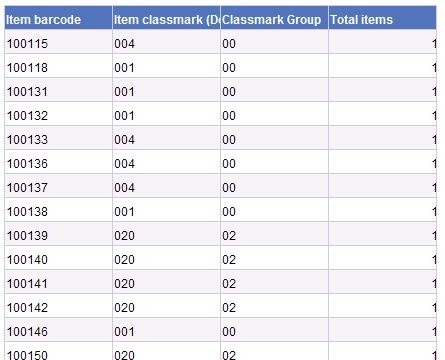
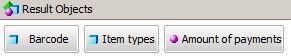
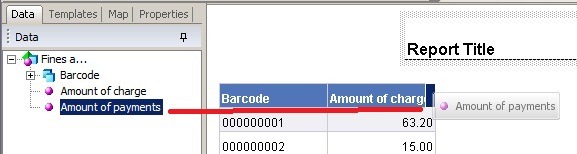
Drag and drop this variable into the table (it doesn’t matter where):

Report with group

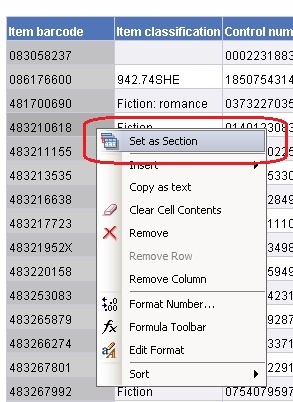
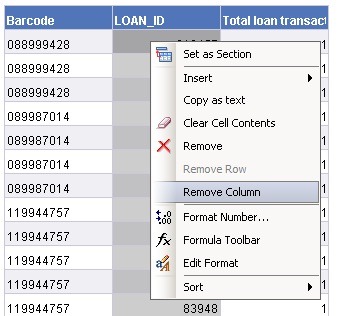
Now Right-click the new Classmark Group column and pick Set as Section:

Setting the Section

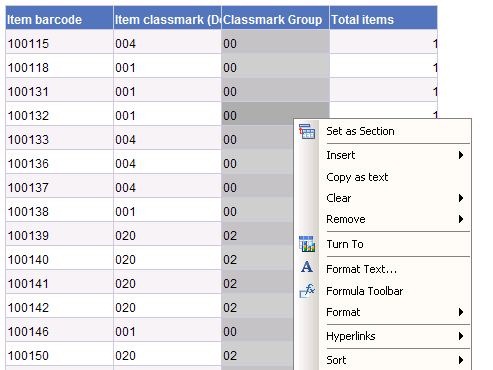
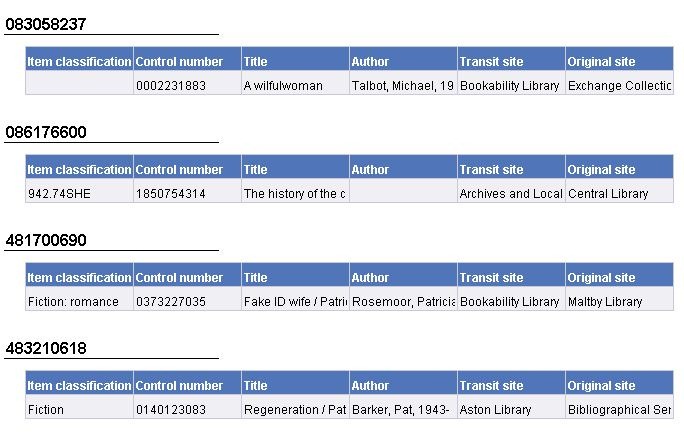
This adds a separate heading for each Classmark Group thus:

Segmented 1

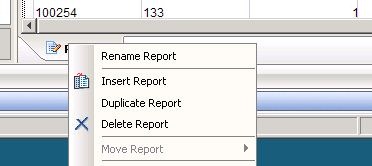
In this example I tidied up the appearance and added some headings etc, and then made two copies of the report tab (right click the report tab):

duplicating the report

I then modified the copies as follows:

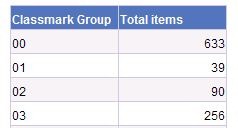
In copy 1 I deleted the Classmark and Barcode columns to give me a raw total for each group 

Summary 1

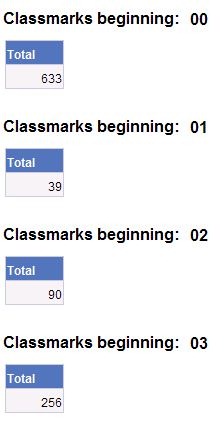
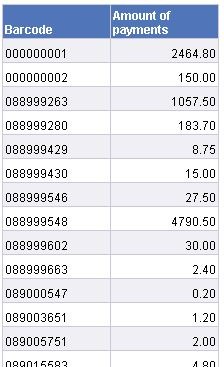
This is actually overkill as you can display the same data just by dragging the classmark group and total items into a new report tab:

Summary 2

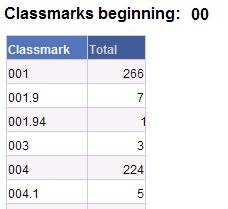
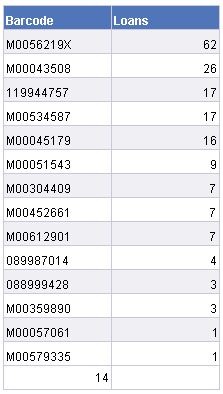
In copy 2 I deleted the barcodes to give me a summary by individual classmark:

By Classmark

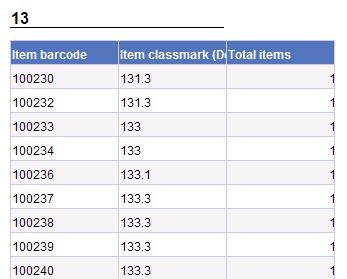
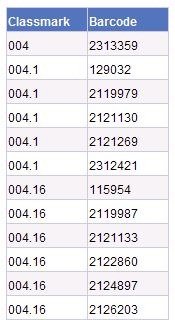
Copy 3 was a detail tab. It listed each barcode and it’s associated classmark, again segmented by classmark group. The item column was redundant and I swapped the barcode and classmark columns simply because it looked more logical that way. Note that this report tab could be huge: it essentially has one line for every In Stock item in the selected range.

detail

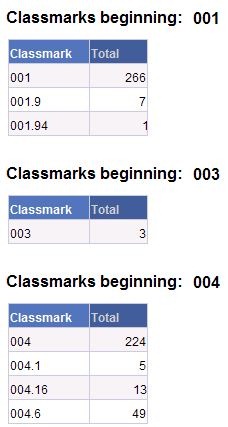
Note that setting up this report takes longer to describe than to do, and once set up will adjust itself dynamically. You can also change the granularity retrospectively. If you decide your groups are too coarse or too fine you can adjust the variable definition (change the 2 to a 3 or a 1 in the formula). The report should sort itself out to match your change. Here for example is the result of changing the formula from =Left([Item classmark (Dewey)];2) to =Left([Item classmark (Dewey)];3)

Variable Change

Note also that this is all done from the same query refreshed once in this example. You should  need neither multiple Web Intelligence documents nor multiple runs of the same document to get the kind of output illustrated here.

Please do leave a comment if this is helpful – or if it isn’t!

Dates and Times in Decisions

One frequent question in Decisions is date format. “Out of the box” Decisions may (depending on the PC’s settings) default to US date format (month-day-year) rather than the [dare I say more logical?] UK norm of day-month-year. This can cause frustration. Here are two examples of the same prompt in Web Intelligence, one with US settings and one with UK Settings. default date 2 default date

Note that the same date (9th May 2012) is selected on the calendar but the actual date displayed in the box is in different formats

There is a Solution on the Support website which explains this, but the key is to go into Preferences in Infoview. Preferences apply just to your own log-in/username and are accessed by clicking a link in the top right of the Infoview page:

                                default date 4

Within Preferences you can then select the “Preferred Viewing Locale”. Set this to English (United Kingdom), save your changes and that should do it.

                                                       default date 3

If it doesn’t, you may need to go further down the Preferences, click on the down arrow next to Web Intelligence and select Use my preferred viewing locale to format the data

Highlighting Exceptions

alerters1Decisions XI R2 offered a valuable facility for highlighting exceptions: Alerters. Alerters permit the report designer to highlight data which meets certain conditions. This makes it easier for an end user to pick out the handful of interesting cases from a mass of otherwise-normal data. In the example on the right, average times to satisfy cross-site reservations over 10 days are highlighted.


alerters2The alerter can be triggered by a comparison between two bits of data. In this example the number of loans per borrower is broken down by site, and the site names colour coded depending upon whether they are above or below average.


tracking 1Decisions XI R3.1 has a further facility to track changes in value through time. There are a number of selectable options: colours, formatting etc but also whether tracking is from a fixed point in time (say the start of a financial year) or since last refresh. This can be used to monitor values that you would expect to remain unchanged. Here for example is a short list of fund codes with their associated fund allocations. Tracking is switched on and has highlighted a row where the amount allocated has changed.

Decisions XI R3.1

Many Decisions users have now been upgraded from XI R2 to XI R3.1. The interfaces of the two versions look fairly similar but there are several nice features in 3.1.

My favourite is Input Controls, which allow people looking at a report in the viewer to filter the data on the fly and without having to modify the report. You are looking at a list of charges and you are only interested in those over a certain amount? Move the slider till you see just the ones that you want. You want to look at jut a few sites? Select the relevant checkboxes.

Input Controls

You could offer the user some “on the fly” selection in R2 using Drill Filters, and this feature is still available in XI R3.1 , but the Input Controls feature is far more flexible for filtering: and won’t accidentally trigger a refresh – which can happen with Drill filters.

There is also now a desktop equivalent of Web Intelligence called Web Intelligence Rich Client. This is just a bit of software installed on your PC, like Word, Excel, Paint or Notepad. Like these applications it can save and open files on the PC. It can be used connected to the main Decisions server or independently. In principle you could email somebody one of these web intelligence files, and they could then take it on the train or up a mountain on a laptop and browse it there with no connection to the Decisions server.

The nicest  thing about “Rich Client” though is its ability to use data from Excel or Web Services. For example, it is possible to combine Excel data that originated in an RFID scanner with data from the Circulation universe to get a list of exceptions (things that should be in a shelf range and aren’t., or shouldn’t be and are)

Capture

Prism 3 data in Decisions?

Sample ChartOne of the items on the Decisions roadmap is to make a selected subset of Prism 3 usage data available in a Decisions Universe. Here is an example that displays Prism 3 visits alongside Loan data on the same chart (click the picture to see a larger version)


Google Analytics LocationVery extensive usage data is already available to all Prism 3 customers via Google Analytics: clearly there is little merit in attempting to reproduce all of that, but it may be helpful to have a few key metrics duplicated in Decisions. This may be useful when (as above) you want to display Prism usage alongside other library data (such as loan counts) on a single chart. It may also be useful for assembling routine reports such as month- or year-end where different aspects of library activity are consolidated into a single multi-tabular report.


surveyWe would like to ask your help in understanding what Prism metrics (if any) you would find most useful in Decisions. We ran a webinar some weeks ago asking this question and a number of folk attended and kindly gave us feedback.

We would now like to throw the question open to everyone on the list. There is a one-page survey at:

https://www.surveymonkey.com/s/KL6G6VS – it will be open until 6th March.


We would be most grateful if you would spare a few minutes and take a look. If you don’t think it is a feature that you would use, that’s valid too; please email john.hardy@capita.co.uk  directly or put something in the “notes” section of the survey.

Many thanks

Transit Items

It’s been a while since I last posted: I’ve refrained whilst the switch between a “Talis” blog and a “Capita” blog has been going through. I’d like to restart with a worked example which illustrates some interesting issues.

I was asked recently about a report of items that are In Transit and have been so since a specified date. This is on the face of it relatively straightforward. A query like this should do it:

transit query

This produces a default report in tabular format:

transit default report

Apart from some resizing of columns, adjusting alignment and word wrapping, this looks close. And it is, in terms of data content.tranisit section context menu


Not in format however. The person requesting the report wanted the output as one small vertical table by barcode, presumably because they were used to scanning data in this format. The first step is to section the report on barcode. A section is an area of the report where everything shares some characteristic: you might for example want to section a report on site, or month in year. There are several ways to create a section. If you already have a table which has the relevant column in it then the easiest way is to right click the column and choose “Set as Section”. In this example we are going to section on barcode.


This has the effect of breaking the table up into one section per row with the barcode as a section header:

transit sectioned by barcode 

transit changing table type

The final tweak is to turn the horizontal table into a vertical one. If you select the “template” tab in the left hand pane and navigate down into the “tables” folder you will find “Horizontal Table”. Drag this and drop it onto the existing table.


transit horiz table


This will change the table style into what we want:


transit properties


There are a few further changes we can make to tidy up the appearance of the report. The first thing is to drag the right hand edge of the table to give more space for the data. Secondly, the display of the Barcode is a bit messy with an underline far longer than the data. Visual tidying is mostly done in the “Properties” tab with the thing you want to change selected.


The end result after a little more tidying is below.  In this example I have

  • Turned off the barcode underlining (click on “Borders” in the properties tab)
  • Moved the barcode field across to the right
  • Inserted a blank text cell before it and typed “Barcode: “ into the cell
  • Right aligned the left hand column
  • Increased the width of the right hand column

transi horiz table tidied

(Note: that the fuzzy grey line between sections is visible because the section boundaries were selected in the editor. They are not otherwise visible).

It is possible to nest sections. In my next post I’ll use this to illustrate sectioning this report on to/from sites.

Reporting Fines and Charges in Decisions – take 2

Yesterday I posted in example of reporting fines and charges together. Today I’d like to do an example of another issue that folk struggle with in this area: reporting the loan data associated with charges or payments.

The problem

Suppose you have a list of payments similar to the one in yesterday’s blog post (query on the left, results on the right):

2 Fines 4

2 Fines 5 

Now merely drag in the Item type and refresh. This returns wildly spurious results, and to add insult to injury takes a long time to run:

2 Fines 6

2 Fines 7

2 Fines 3 The reasons for this are complex but part of the issue is that payments and the items related to those payments are not straightforward. Alto must store its data so that it can handle part payments, reservation charges, hire charges, fines, payments that are waived: even payments that are unrelated to a loan at all. Here for example are two lists for a single loan (a loan of a given item to a given borrower, identified by LOAN_ID). We can surmise that this was a hire item with a hire charge of £1.85. There is more discussion of this in this forum post.

A solution

The key to handling this area is to use queries linked on LOAN_ID. Suppose that we want to list fines or hire charges by loan type and location and include the borrower barcode so we can easily cross-check against Alto.

First we need to be clear about what exactly we mean by “location”. Do we mean the location where the item was issued or discharged, or where the payment was made? What if (to take an extreme example) a hire item was renewed three times at different locations and payment taken as a mixture of transfers from credit and part payments – and some of the charges were waived? The answer is likely to depend upon the use to which the information will be put. If it is about planning location of tills, presumably location of the payment is critical. If it is about circulation, then the location of the original issue may be significant. We have assumed the latter in this example.

The type of charge (Fine, hire charge etc) is related to the charge so if we want to restrict our charges to a particular type, we will have to get the charges too. So in this example we have three queries. All three contain LOAN_ID which is what we will use to link them together in the report.

2 Fines 8 2 Fines 9 2 Fines 10

Note that the charge query is filtered to return just Loan Fines, and the Loan query has a filter on date range. The latter is critical if the query is going to return fairly quickly. The loans are also limited to Issues. This means that the “site” will be the one where the item was issued.

2 Fines 11

Having refreshed these queries, you will have the usual default reports. As in the previous example you can delete the report tabs and start again. As before I created an “Owing” variable. To create the report, drag everything except the CHARGE_INCURRED_ID into an empty report tab. Select the table and place a report filter of “Amount of Charge > 0” on it. This ensures that only charges for the selected Charge Type (loan fine in this case) are displayed. After the usual formatting, the final result looked like this:

2 Fines 12

Summer Reading Challenge

One Decisions report I’ve been asked about is how you report loans that have been completed from start to finish within a certain period of time. This is relevant to the Summer Reading Challenge in public libraries where participants are “challenged” to read 6 books between two dates.

The problem

Listing the number of issues that a borrower has had in a date range is easy. Listing the number of discharges is also easy; but what we want is to count loans where the issue and the discharge both occur in the date range: i.e. we want to ignore any discharges without a corresponding issue and vice versa.

The solution

There are several ways we could tackle this. One is to take advantage of the fact that Alto uses a unique LOAN_ID for each loan, and use a “combined query” in Decisions. For this example, I’m assuming that participants in the Summer Reading Challenge in a particular year are identified by a particular interest code. If this is so, the procedure is as follows:

Create a query with the following data in it:

  • Borrower Barcode
  • LOAN_ID. This is at the bottom of the tree structure of objects in the universe:
  • Total Loan transactions

SRC1

SRC2

SRC2a

NB: it is vital to limit the date range on the loans. Here I’ve add start and end date prompts which make the report re-usable – you can change the dates any time you refresh it

SRC4

Ad a query filter on the Interest code (or other identifier of participating borrowers)

Now click on the Combined query icon in the toolbar. This creates two queries out of the original one with the same data in both. You can select which one you want to look at in the bottom left pane.

SRC3

SRC5

Combined queries must return the same data items but can have different filters: indeed you will have to add the date and Interest filters back into Combined Query 2. Ideally use exactly the same text (including spaces, capitalisation and punctuation. Decisions will the combine the two prompts)

Here comes the clever bit

  • In Combined Query 1, add a Query Filter to restrict the rows returned to just the issues
  • In Combined Query 2, add a Query Filter to restrict the rows returned to just the discharges
  • Double click the word “Union” on the left of the Combined Query box until it reads “Intersection”.

SRC7

SRC6 Now refresh the report. What Decisions does under the bonnet is go away and get a list of all the issues in the period for Borrowers with the selected interest code. It then gets a second list of all discharges in the period for Borrowers with the selected interest code. But it displays only those Borrowers and Loan ID combinations that are in both lists. In other words if the one query returns a Borrower barcode/LOAN_ID but the other one doesn’t, it isn’t displayed.

SRC8 After the refresh you will get a default report with a table in it. This contains all the barcode/LOAN_ID combinations  as described above along with a column of transaction counts. The latter will be a bit dull, being uniformly “1”. Delete the LOAN_ID column (right click and select “Remove Column”). This will leave you with a list of barcodes. The “Total loan transactions” column should adjust itself to the total for each barcode. As described in the post on fines, you can add a filter to the table and limit the data displayed to whatever value you like (e.g. 6 or more for the Summer Reading Challenge. As before, select the table before adding the filter)

SRC9 If your interest is primarily the total number of qualifying borrowers rather than the detail, you can right-click the barcode column and select Count in the maths drop down  to get a total at the bottom of the table.

You can tidy the report up further by tidying up headings and column widths. In this example, I have also sorted the table on descending number of loans. This is done by right-clicking the column you want to sort on and selecting the sort option. The end result looks something like this:

SRC10

You can add further report filters to remove known exceptions. For example the top barcode in this list might be a dummy used for outgoing ILLs that had been mistakenly coded with a Summer Reading Challenge Interest Code.

If you are a Capita Libraries customer, you can download a zipped BIAR file below containing a sample report. If you download it and try it, please do let me know how you get on with it. If you would like it but cannot download it, drop me an email.

2011_09_05_SRC.zip (log in required)

Reporting Fines and Charges in Decisions

The reporting of fines and charges in Decisions can be unexpectedly difficult. This post tries to explain why and gives a simple example of a fines/charges report that can be extended/adapted to suit local needs. The main issue that can cause confusion  is the way that databases handle joining two lists of data together.

The problem

If you ask most databases or information system to join two lists and present you with the results, the system has a choice to make. Did you want:

  • All of both lists?
  • Only those items that appear in both lists?

For example if you have a list of borrowers and a list of books and you ask for a list of which borrowers have borrowed which books, do you want to include all the inactive borrowers and all the books that were not loaned at all? These sorts of questions are often (but not always) obvious to a human but aren’t obvious to a computer. Sometimes they aren’t obvious even to a person: for example if you ask for a list of books by format, what about those that aren’t classified by format at all?

None of this is a problem if you just want a list of charges incurred by borrowers, or just want a list of their payments. The problem comes when you want a list of what each borrower owes, because that is logically all their charges minus all their credits (paid/waived). If you compose a single query in Decisions to get a list of borrowers, their charges and their credits you are in effect asking for a combined list and (unlike a human observer) the database cannot figure out from the context that you will want all the borrowers with charges regardless of payments. In this case unfortunately it will assume that you only want data where there are both charges and payments and the results will not be at all what you want.

The solution

Fortunately the solution is fairly straightforward: ask Decisions to get the two lists separately and then combine them in Decisions. Here is a simple example which lists all borrowers who owe more than £50.00. The logic is exactly the same as that described by Brian in this forum post.

The Queries

Ask Decisions to get all the charges by barcode using the Circulation Universe in one query and then all the payments in a second query:

Fines 1

Fines 2

The report

When you refresh these queries, Decisions will go and get the two lists and will display them side by side in two tables in a default report. You can delete that report tab if you wish and start again, or do as I have started to do here and delete one of the tables (right click the edge of the table and select “remove”)

Fines 3

Note in the data pane on the left that Decisions has recognised that “Barcode” is a common data item and has merged it (notice the “+” alongside it). Having deleted the table listing the payments, drag and drop the “Amount of Payments into the first table:

Fines 4

[if you aren’t used to doing this, note that you are looking for the small dark blue vertical rectangle at the edge of the cell labelled “Amount of Charge”). If the whole cell heading is highlighted you will just over-write the amount of charge rather than adding a new column]

You will now have a list of total charges and total payments for each barcode. At this point you can if you wish save it as Excel and take it from there, but if you would like to finish the job in Decisions to save having to redo the Excel manipulation every time, here is how:

Amount Outstanding

In Decisions you can create variables that are built on existing data. There are a  couple of short videos explaining variable on the Decisions website. In this example, we create a variable for the amount owed by making it equal to the amount of charge minus the amount paid:

Fines 5

Drag this new variable into the table in exactly the same way that you did the amount of payment

Limiting to Borrowers owing over a given amount

If you would like to limit your list to Borrowers owing over an certain amount (say £50.00) then you can use a filter on the table (this is different to filtering the query). The steps are as follows:

Fines 6

  • Click on the Show/Hide Filter Pane button
  • Select the table (a selected table has a thick grey border). Don’t omit this step.
  • Drag the “Amount Owed” variable into the filter pane
  • In the pop-up that is displayed, select  “greater than” or “greater than or equal to” and enter “50” of whatever your chosen limit is and click OK.


Fines 7

Tidying Up

If you would like to distribute the report routinely it may be worth tidying it up visually. You can for example

  • Format the Currency columns
  • Resize columns
  • Amend Column heading text, centre it, set word wrap on etc
  • Add a Title
  • Reposition the table

Fines 9

Technorati Tags: ,,,

Dashboarding in Decisions

One issue that comes up from time to time in the context of Decisions is Dashboards. “Dashboard” means different things to different people, but the core is typically a collection of graphical reports designed to give a specific user an at-a-glance overview of performance or outcomes in areas that are of interest to them.

My Infoview Decisions is not primarily a tool for constructing dashboards, but it is certainly possible to put together simple dashboards for specific users. Here is an example intended for a hypothetical acquisitions manager. Dashboards in Decisions are constructed using the “My Infoview” option. This permits the user to specify a number of panels (this example shows three) in almost any rectilinear combination of size and position.

My Infoview 2 “My Infoview” is accessed from the menu toolbar (this example is from XI R3.1). It is possible to set up a user’s preferences so that they go to their “My Infoview” page by default when they log in. There are many options but the example shown was created using the following settings:

My Infoview 3The Properties of the report pages were set so that the report margins were zero and the headers and footers suppressed. The graphs and charts were sized to fit the space available and positioned at the top left of the page .


My Infoview 4 Also the properties of the “My Infoview” report panels were amended to suppress the headings and headings were added to the chart: this is however purely a matter of preference


Not everyone has a need for a dashboard, but dashboards can be helpful, and the facilities in Decisions are quite adequate for most users.