Decisions Blog

Data Visualisations

SAP (the company behind the BusinessObjects software that powers Talis Decisions) have a service available on the Internet called BI on Demand. A basic subscription (with limits on data volumes) appears to be free. This can sometimes be useful to experiment with visualisation of Excel data. Creating a visualisation from an Excel spreadsheet is a straightforward process:

  • Log in
  • Upload the spreadsheet
  • The system does its best to sort out the data and you can then view and amend a default visualisation in the “Explore” tab:

BI On Demand 1

BI On Demand 2

BI On Demand 3

The visualisation is highly dynamic: it changes almost instantly with changes in the drop-downs.

The other thing about this service however is that it can use a query on the Talis Platform directly so that for example it is possible to generate visualisations of Talis Prism 3 or Talis Engage data directly from the underlying store. Here for example is a visualisation of the frequency of occurrence of various Dewey values in the top 50 items in the library catalogue containing Magnetohydrodynamics in the title:

BI On Demand 4

It isn’t a complete answer to visualising data – but in some circumstances it may be another option to consider.

Publicising your Library’s Performance

Purdue University in Indianapolis, USA, have an entire set of library  website pages dedicated to publicising data about the library:

clip_image001

Note the buttons across the top which allow access to statistics about different areas of the library’s operations.

This particular example is a fairly sophisticated site, but it would be perfectly possible to prepare a set of “Public facing” reports using Talis Decisions and generate pdf to embed in a web page. Another alternative would be to output the data as Excel and use a tool such as  SAP Crystal Dashboard Design (formerly Xcelsius Engage) to display the data on your web page.

If you have experience of putting library statistics on data up for public display, we would be interested to hear of your experience – whether it was helpful/well received.

Technorati Tags: Xcelsius,Talis Decisions,Dashboard

Reservations – time awaiting collection example

A Talis customer recently asked me about reporting on Reservations that had been sitting on the Reservations shelf for longer than a defined period of time. They wanted this to speed up the process of pruning uncollected Reservations. I thought that it might be useful to share my suggested  approach  more widely.

The Query

clip_image002

The base query uses the Reservations Universe. These are the minimum data items for illustration. Other data (like barcodes) can be added if required.


Default report

clip_image004

When this query is run, the data are retrieved, a default report created and the view switches from Query to Report


Getting the Days Waiting

clip_image006

There is no measure in the Universe for Days Waiting. This can however be constructed using a variable. Click the variable button and fill in the dialogue in the usual way. I called the variable “Days Waiting” but you can use any name that you wish.


The “formula” used in this example was:

=DaysBetween([Date satisfied];CurrentDate())

This uses the built in functions (similar to Excel functions) DaysBetween() and CurrentDate().

clip_image007

Once created, the variable can be dragged and dropped into the report like any other data item


Note that to add the column (rather than overwrite the Borrower Name in this example) there should be a small highlighted rectangle on the end of the column heading as shown.

You might want to set the Qualification to Measure if for example you want to reuse it in a chart or graph on a different report

clip_image009

NB. You might find that the data displays as “#FORMAT” rather than the expected value. This indicates a mismatch between the format expected by the column and the numeric format of the data. Select the data in the column then right click and select Format Number:


Filtering down to just those with excessive waiting times

So far the report lists all items waiting collection regardless of the length of time that they have been waiting. Suppose that you just want to display those cases where the item has been waiting more than 14 days. This could be done by filtering on the query, but it is easier and more intuitive to filter the report instead. If you are unsure of the principle here, there is a five-minute video at  http://www.talis.com/decisions/videos/video_intro.shtml entitled Using Filters in Talis Decisions. Here is a brief overview:

  • Select the table

clip_image011

  • Click on the “Show/Hide Filter Pane” button. This opens up the filter pane at the top of the report. Drag Days Waiting into this area.


    clip_image013

  • This opens a dialogue. Set the Operator to “Greater Than” and the value to “14”:


Subdividing by Site

clip_image015

If you want to subdivide this report by site, you have several options. One is to right click the Site for collection column and select “Set as Section”


clip_image016

This creates a separate section for each site thus:


Tidying Up

This is largely up to the user. Some options might include:

  • The Date Satisfied can be removed if not required

    clip_image018

  • Columns can be re-order by dragging (the same insert/overwrite convention mentioned earlier applies)


  • Column widths can be adjusted by dragging

clip_image020

  • Sort order can be changed by right-clicking the relevant column


 clip_image022

  • Colours, fonts etc can be adjusted in the “Properties” tab


  • The report title can be removed or tidied up

I hope this example is useful. As ever, please do add any comments or observations on this report or any alternatives that you use locally.

Talis Decisions reports for Talis Bridge Pro

In May, I mentioned a set of reports on Self Service Terminal activity for Talis Bridge Pro users who also have Talis Decisions.

These are now available for download from the Talis Decisions Downloads page. A Password is needed and is available by contacting sales@talis.com.

These reports were kindly beta tested by several Talis customers, but we’d be very grateful for any comments, either positive or negative

“What they really, really want”

A colleague just pointed out to me an article on stock management in the CILIP Gazette dated 28 Jan. written by Susan Wills , Stock Development Manager at Kensington and Chelsea. It contains some very good ideas:

  1. monitoring reservations as a clue to demand,
  2. monitoring supplier selection with an annual update of specification in the light of a stock audit
  3. Use of a council geo-demographic service (Mosaic) to analyse borrower postcode distribution

More important than this however, Susan Wilks describes a management culture predicated on data rather than opinion. It contains the classic line:

“We need to be much more proactive in the way that we respond to customers by considering what information we can use to improve predictions of what they might want – before they ask us”

A brilliant article. It is on page 4 of the Gazette.

Self Service Terminal Reporting for Talis Bridge Pro

Self Serve 1 In October last year I blogged about the use of Talis Decisions to monitor the usage of Self Service terminals in Libraries. These devices are expensive and managing them effectively is important.

We are in the closing stages of developing and testing a number of standard reports very much along the lines of last October’s posting. This suite of reports is currently being beta tested and it is hoped that they will be available in the next few weeks for Talis Bridge Pro users to install and run. Please contact sales@talis.com if you would like to be advised when these Talis Decisions reports become generally available.

Note that the first release will be for Talis Decisions XI R2 (given the number of libraries still using this version). A release for XI R3.n will follow shortly thereafter.  The package contains:

  • A set of 11 pre-written Talis Decisions reports as a BIAR file
  • Full step-by-step instructions for installing and running the reports
  • A user guide designed for non technical staff using the reports
  • A couple of image files used to embellish the reports visually

The reports are designed to be distributable as-is, but because they are just written in the normal Talis Decisions environment, it is easy to modify colours, graphics, chart types and/or remove unwanted reports:

SP32-20100506-111505

The full documentation of installation was intended to make it easy for libraries using Talis Bridge Pro to install and run the reports themselves: but as ever we can structure consultancy projects to assist in this process. Speak to your Account Manager if you think you may require this kind of assistance.

Talis Decisions Days

Over the last couple of months we have had a couple of Open Days at the Talis offices focussed on Talis Decisions. These have been well attended – there must have been 35 – 40 people attending across the two events. From the feedback we received afterwards, the events also appear to have been much appreciated by those who came.

For me the most interesting part of these days has been the reasons folk have given for attending. For many there seems to be a desire to get more out of Talis Decisions. The kinds of things people have been saying are:

  • “…come to see if what we are doing is right”
  • “…looking to pick up tricks for using it – been using it the same way since it came out…”
  • ”…don’t feel we are getting the best out of it…”
  • “…looking for hints and tips…”
  • “…want to understand what more can be done in Talis Decisions than in the earlier [v5i] versions of Business Objects…”
  • “…know we aren’t using it to its full extent…”
  • “…interested in worked examples…”
  • “…want to know how to get more out of it…”
  • “…like to reduce our use of Excel for management reporting…”
  • “…want to understand the kinds of things it will do…”

Accordingly as part of the day, there was a top-to-bottom worked example around stock management and Brian Crampton did a “clinic” on report authoring based on some of the questions raised by attendees. We are also planning to supplement the existing Training videos with a 2 or 3 additional ones that look at Talis Decisions from that slightly higher level of “what kinds of things can you do with it” rather than just “this is how you create a chart, build a variable or schedule a document”.

If you attended one of these days, we would be interested to know whether what you learned has turned out to be helpful in practice. If you didn’t, attend would this kind of event be something that you would hope to attend if we held further ones in the future?

Using Talis Decisions on Amazon EC2?

One of a number of services offered by Amazon is their “Elastic Cloud Computing” (EC2) service. This in effect allows you to take a snapshot of a server configuration and then run it up any time you want without having to worry about which physical machine you are using or where it is. You only pay for the time that you are actually running the server. This tends to be less expensive for services that are only used occasionally. There are in many cases also issues of backup, software licensing and security of connections to other computers on an internal network. Using it 24×7 would work out to be quite costly on a per annum basis.

We are increasingly using Amazon  EC2 internally for training and demonstration and it has been suggested that we could usefully offer a demonstration environment to customers for a day or whatever.

For a few users it might even be advantageous to consider moving their operational service onto EC2, although a number of issues would need to be investigated and resolved.

If you have any thoughts or suggestions on whether this would be helpful, please do leave a comment. If you use your Talis Decisions service infrequently enough to make EC2 an attractive operational option, please talk to your account manager

Reservations and Items (part 2)

Last week I posted an example of a report showing data relating to Reservations. To finish that example off, here is the procedure that I used to create a chart based on the same data. It may be useful in itself, but more importantly it illustrates some general principles about using charts in Talis Decisions.

Background

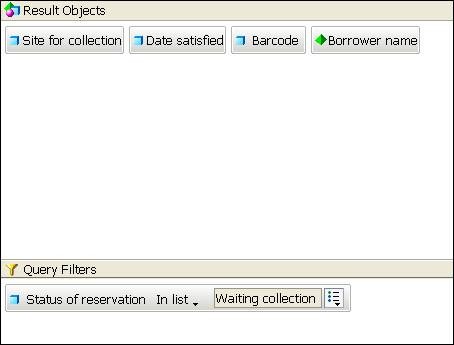
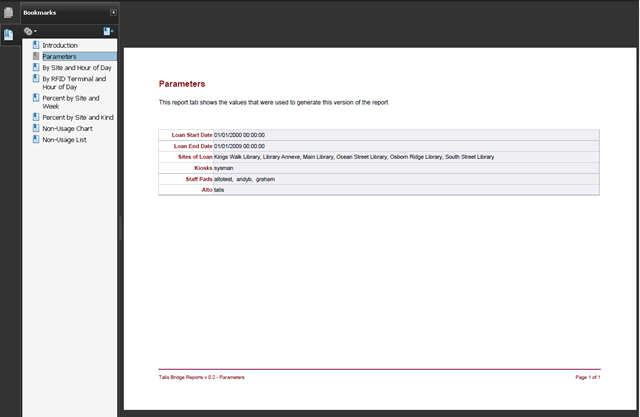
You will perhaps recall from that earlier post that the report had the following basis:

  1. A query returning Control number and Total number of reservations from the Reservations Universe
  2. A query returning Control Number, some further Bib data (not used in this example) plus the Total number of Items – all from the Circulation Universe
  3. Merging on the Control Number dimension to synchronise the queries

The Chart

SP32-20100329-101257 
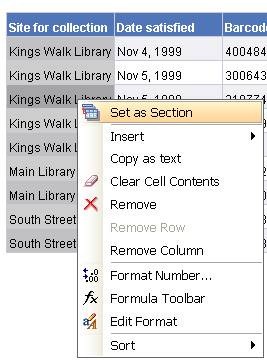
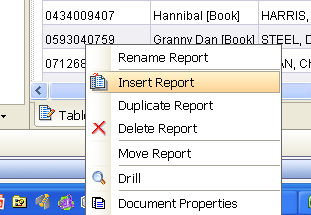
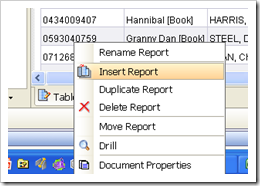
To create the chart, first create yourself a new report (i.e. a new tab in the report section of the document). The easiest way to do this is to go into the report view, right-click an existing report tab and select Insert Report.

This adds a new, blank, report tab to the document. You can right click the new tab again to change its name, and/or to move it’s position relative to other report tabs.


SP32-20100329-103429 
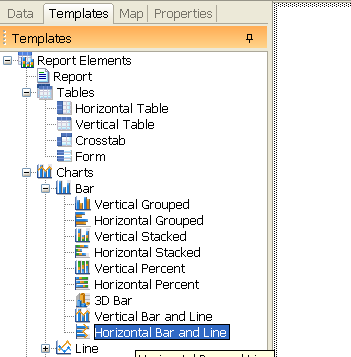
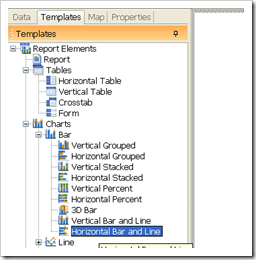
Now go to the Templates tab in the data and controls area, click on the plus sign by Charts, then the plus sign by Bar. Drag  Horizontal Bar and Line into the working area.


SP32-20100329-103918 
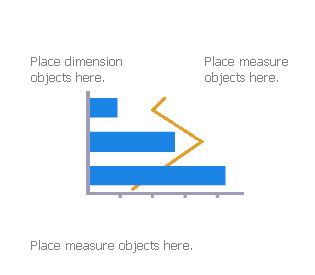
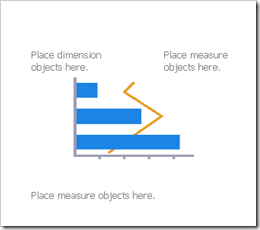
This puts a chart widget into the working area and switches automatically to the Structure view (any report can be viewed either as Results or as Structure by toggling the View Results/View Structure button at the top centre of the report view).

As the terminology implies, the Structure view shows the report definition (e.g the formulae used in specific table columns) and the Results view shows the actual data


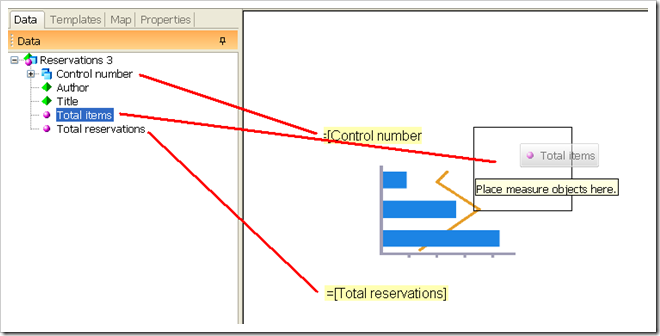
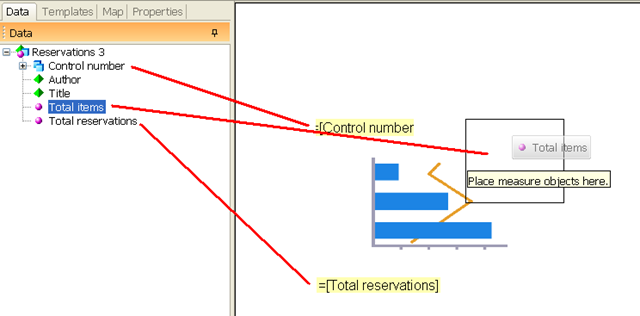
Switch back to the Data tab and drag the Control Number and the two measures onto the chart widget as shown:

SP32-20100329-105112 

If you switch to Results View now you may not see much. There are a high proportion of items with null reservations and the chart will not know how to plot these. You could add a report filter as described in the previous post to remove the null values. You could also take the same approach to sorting.

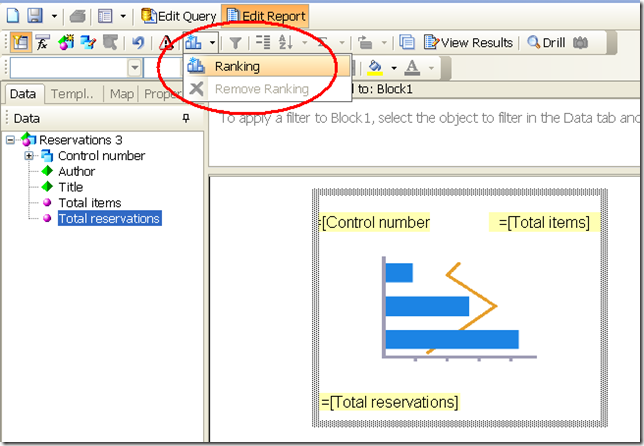
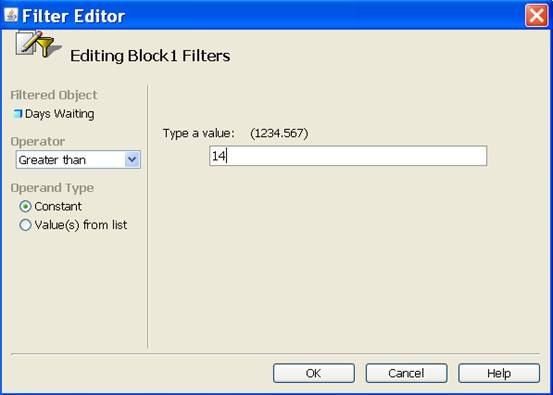
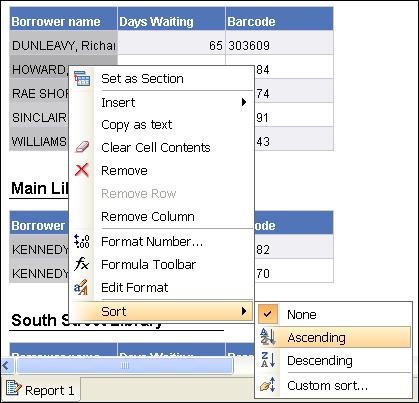
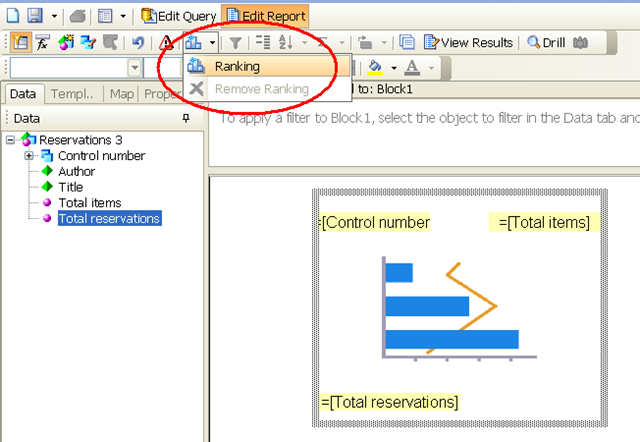
An alternative which will not only get rid of the null reservations, but will also cut the values down to the top 5 (or 10 or whatever you specify) AND sort by numbers of reservations is to use the Ranking function. Select the table and click on the Ranking icon:

SP32-20100329-111732

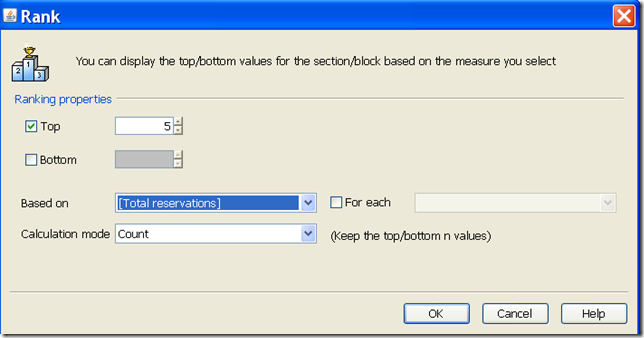
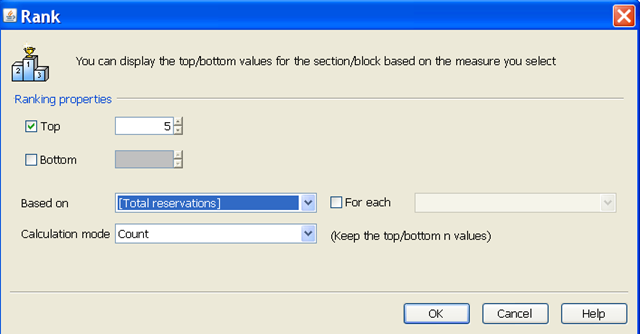
…then complete the dialogue:

SP32-20100329-111801

SP32-20100329-112937

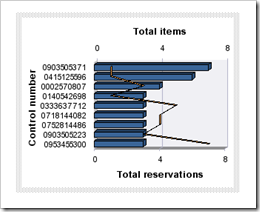
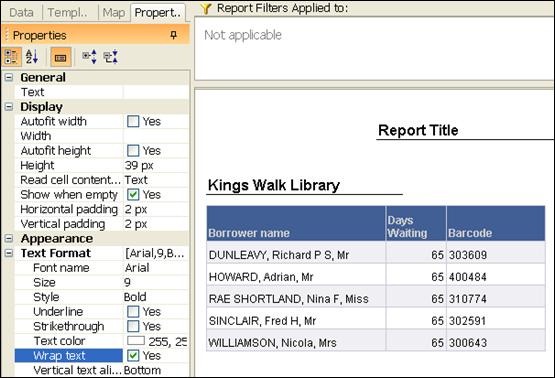
Now when you view results you will see something like this. Finally you can tidy it up to make it more readable. Select the Chart and click on the properties tab in the data and controls area. As a starter you might try:

  • Width 600px
  • Height 400 px
  • Uncheck 3D look
  • Check Legend
  • Under Values, Check Show Data.

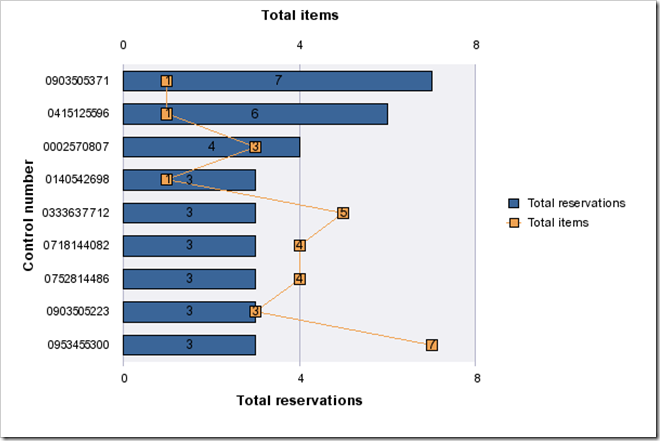
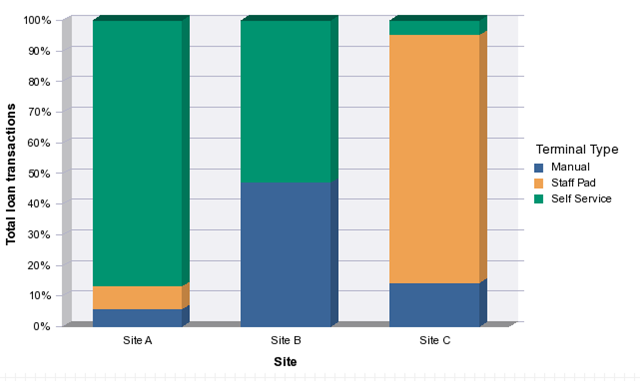
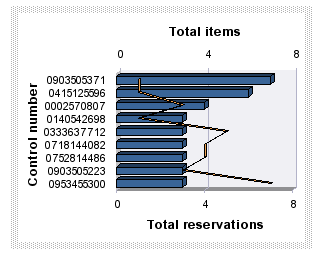
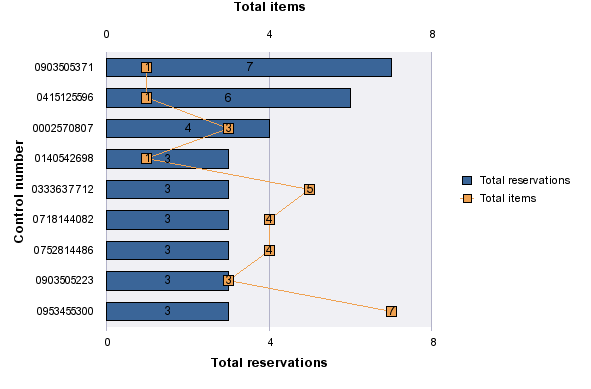
These changes would give you something like this:

SP32-20100329-113942

Interpreting the Results

It is arguable that, all other things being equal, the orange line (number of items) should roughly mirror the blue bars (number of reservations) because this would imply that the ratio of numbers of copies to the number of reservations would be about constant. However this picture would be distorted by issues such as:

  • Seasonal effects (e.g. textbook usage in an academic library)
  • Transitory effects (e.g. a title which was a Booker prize winner last month)
  • Cost: if in the example above the top ranked item (Control number 0903505371) was very expensive but the fourth item (0140542698) was low cost then the latter might be prioritised ahead of the former.

In Conclusion

As ever, it would be useful to know how useful examples such as this one are. Please do let me know if this is helpful; and if you need further creating reports like this, please do feel free to speak to you Account Manager.

More Free Training Videos

The training videos on the Talis Decisions Website have been extended again. They have also been re-organised into three sections. Each contains a set of bite-sized videos (about 5 minutes long) as follows:

  1. An introduction to Talis Decisions covering the basics of creating, editing, filtering and scheduling Talis Decisions documents
  2. Variables – creation and use of variables, which greatly extended the flexibility of reporting
  3. A tutorial on visual dashboards

SP32-20100326-141652 The last one of these is new. It shows in a series of videos the construction of an example of a dashboard which displays actual performance against a Key Performance Indicator (KPI). The KPI chosen is fictitious but the example shows what can be achieved, and a number of techniques which are of wide applicability.


As ever if you would like to discuss how to go about making such reports available to your users, please contact your account manager